Executive overview
Microbubbles in leading-edge photoresist materials create a challenge to the demanding yield requirements of today’s shrinking circuit designs. When microbubbles are dispensed onto a wafer surface, they can act as an additional lens in the exposure path, ultimately distorting the pattern and affecting yield. Proper filter selection, filter priming, and dispense settings chosen during process startup are critical to reducing microbubbles, but certain chemistries can continue to cause problems even if the process has been optimized. This paper presents the results of a study in which a small amount of positive pressure was applied on the chemistry before the dispense nozzle to reduce microbubbles in top anti-reflective coating (TARC).
Each photolithography step in semiconductor manufacturing provides the opportunity for failure, which must be at the very least mitigated, but ideally prevented. It is, therefore, critical that lithographers set up their processes with the best-known equipment and methods to ensure success with each dispense.
In particular, top anti-reflective coatings (TARC) create microbubble defectivity challenges due to the surfactants in the chemistry that can trap bubbles. Bubbles are not formed suddenly, but grow over time with changing conditions in the dispense system. There are at least three known mechanisms for bubble formation, two of which are directly applicable to photochemicals [1,2]:
– Heterogeneous nucleation. Bubble growth occurs when a hydrophobic surface, including a membrane surface and particles, act as catalysts for the formation of bubbles when gas solubility is reduced.
– Cavitation. Similar to heterogeneous nucleation but only occurs when bubbles are formed at nucleation sites directly due to a reduction in pressure of a moving fluid. This is the most likely cause of bubble generation in a dispense system when fluid is being pushed through a point-of-use (POU) filter.
Regardless of bubble formation mechanism, if the TARC already includes some saturated gas, a drop in pressure applied to the liquid will allow for the gas to come out of solution and create bubbles. Therefore, keeping the pressure drop in the system low will prevent, if not eliminate, bubble formation [3].
There are at least two ways to remove the bubbles that may be present in solution moving through the dispense system: fill voids in the point-of-use filter with fluid, and add some pressure to the fluid to keep saturated gas in solution (the method explored here).
To prevent microbubble defectivity, lithographers should concentrate on properly installing the chemistry, carefully selecting the point-of-use filter, priming the filter properly, conscientiously setting up a coating recipe, and optimizing dispense recipe parameters [4,5].
This article focuses on the challenges that are directly related to the dispense pump and point-of-use filter, in particular, microbubble generation and elimination.
Common TARC dispense challenges
When addressing the many challenges of working with TARC dispense systems and POU filtration, lithography equipment engineers need to consider: Which POU filter should be used? And what are important dispense system settings for accurate dispenses and low defectivity?
POU filter choices. Considerations: Particle and microbubble retention, chemical compatibility, and filter lifetime.
Filter offerings for TARC applications:
– Traditional PTFE filters do not have the wettability of UPE filters for aqueous applications [6].
– Smaller pore size filters are optimized for removing the smallest microbubbles generated, while larger pore size filters are more apt at removing larger particles. But not all dispense systems can handle the smallest pore size filters, and the combination of a poorly programmed dispense with a tight pore-size filter will create even further defectivity.
– Filter priming, another consideration key to defectivity reduction [7]:
— Recent Entegris testing [3] has shown that the application of pressure to the downstream portion of the filter during filter priming can rapidly eliminate bubbles and decrease downtime due to filter change-out.
Dispense system considerations. Generally, TARC is applied to a wafer in a static dispense to reduce the likelihood of generating microbubbles and defects on the wafer surface during dispense, which is a root cause of defectivity in TARC applications. Microbubbles may also build up in the dispense line of a TARC system, sometimes caused by [4,5] air building up in the dispense line as it attempts to filter TARC at too high a rate [6].
When choosing a two-stage dispense system like the Entegris IntelliGen Mini, filtration rate is set completely separate from the dispense rate. Therefore, a low, controlled filtration pressure can be set to control the flow of chemistry through the filter. If microbubbles do form in the outlet, the build-up of visible air is generally caused by the system sitting idle for long periods of time between production lots, since TARC is not generally applied at every process level. This idle time allows the microbubbles to coagulate and form larger bubbles.
One way to remove the air is to purge the system; however, unless the system is automated, this method can waste expensive chemistry and valuable processing time on the track. Even with an automated purging and venting sequence, microbubble generation in the outlet is still possible if the settings are not carefully considered. On a two-stage dispense system, automated venting and purging capabilities are available, and specific recommendations have been made for the system [6].
A few of the most important factors to prevent bubble building in the outlet of a two-stage dispense system are:
– A high fill rate to ensure chemistry is being pulled towards the pump during recharge;
– A low filtration rate to reduce the likelihood of microbubble generation at the filter;
– A significant amount of purge during each cycle to remove any bubbles building up at the dispense outlet in between cycles;
– Venting each cycle to remove any bubbles generated in the filter.
In addition to the recommendations listed previously, current dispense technology gives the user new tools to prevent and mitigate bubble growth in the outlet of the dispense line. The dispensing system used for the work in this paper allows for the application of pressure to the filtrate to additionally reduce microbubbles, and features a ready pressure setting whereby a specific amount of pressure is applied to the filtrate between the filter and the nozzle. This pressure is applied to the filtrate while the dispense motor is at a ready state. It is believed that adding a small, positive pressure to the filtrate will allow for microbubbles to dissolve into solution and prevent bubbles from growing in size.
A simple experiment was undertaken to determine the effect of a small, constantly applied pressure on TARC microbubble formation. The experiment utilized AZ Electronic Materials Aquatar III-45 as a representative of the TARC used in today’s high manufacturing semiconductor environment.
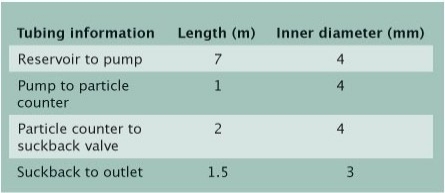 |
| Table 1. Experimental setup description. |
Experimental setup
The physical setup of the experiment, as described in Tables 1 and 2, included:
a. An AZ Aquatar III-45 reservoir
b. The dispense system with varying Entegris POU filters
– 0.1μm ultrahigh molecular weight polyethylene (UPE) filter
– 0.02μm photochemical modified (PCM) filter
c. A PMS Liquilaz SO2 optical particle counter (OPC) installed downstream of the filter, automatically collecting a data point every 50 seconds.
d. A CKD stop suckback valve
The dispense and filtration parameters were specifically chosen to reflect a dispense recipe that is not fully optimized for bubble purging. This particular setup created a challenge for the pump to remove bubbles that may have been created during filtration occurring between venting cycles.
In addition to the physical setup in the lab as described, the dispensing system was hooked up to its network platform.
The dispense system was initially primed with a flushing shell to ensure the system and tubing were fully wetted. Next, the filter being tested was installed and primed with the best-known method until the particle counts reached a steady state.
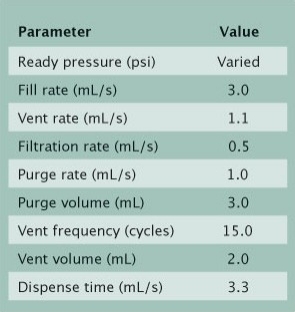 |
| Table 2. Dispense recipe parameters. |
Once the filter was properly primed, a specific, controlled pressure was applied to the filtrate by the second stage of the dispense pump.
The pressure was applied for a minimum of 8 hours to represent the time in between potential TARC lots, since TARC is not applied at all levels on all products. After this time at rest with the applied pressure, 1,000 dispenses were performed and the particle counter data was measured. A new pressure value was applied after each test, and the process was repeated. Testing was performed from 0psi to 3.0psi. In between filters, the particle counter was flushed with de-ionized water.
The first filter tested was a 0.1μm UPE filter, traditionally used in mature lithography processing. The second was a 0.02μm PCM filter, which was specifically designed for use with aqueous chemistries for instantaneous wetting. It also has a higher retention rating, more commonly used in advanced chemistries.
Results and discussion
Particle data reported in the following graphs shows all particle counts per milliliter greater than 0.2μm passing through the particle counter during routine dispenses. The particle counter data was collected at 50-second intervals. All figures, with the exception of Fig. 1, have been plotted with Minitab 15.
The data was all collected remotely utilizing automated data collection by Facility Net software for the Liquilaz SO2 particle counter as well as the network platform. Seven different pressures were applied to the TARC filtrate utilizing the IntelliGen Mini ready pressure setting. Results for both filters and all seven pressures are seen in Figs. 2 and 3.
Figure 1 specifically speaks to the effect of filter retention rating on total particle counts. At 0.0psi applied pressure, the counts are highest for both filters. In fact, the counts for the 0.1μm UPE filter are two orders of magnitude greater than that of the 0.02μm PCM filter. This result not only shows the effect of filter retention rating, but also shows how a filter specifically made for the application can drastically reduce particle counts.
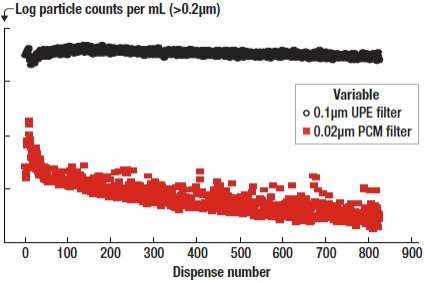 |
| Figure 1. Particle counts for different filters with 0psi ready pressure applied. |
This same effect is shown in Figure 2, showing side-by-side comparisons of the results with the 0.1μm UPE filter and the 0.02μm PCM filter. The scale for both graphs is identical,, showing again that a filter made specifically for the application plays a role in reducing the number of microbubbles generated.
 |
| Figure 2. The effect of pressure applied to the filtrate for the (a) 0.1μm UPE filter and the (b) 0.02μm PCM filter. When pressure is increased, the total number of particle counts decreases. |
Figure 3 shows more clearly the overall results of the effect of pressure applied to the filtrate. When pressure is increased, the total number of particle counts decreases.
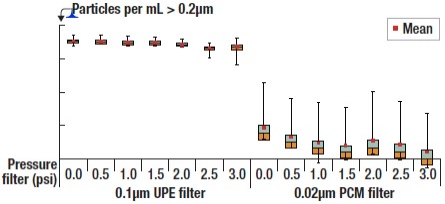 |
| Figure 3. Box plot showing the particle counts per applied pressure for two different filters |
0.1μm UPE filter. The results of the 0.1μm UPE filter testing are seen in Figure 4. As the pressure applied to the filtrate increases, the total counts of microbubbles decreases and the distribution of particle counts narrows; however, after 2.5psi, this effect disappears. It seems that after a certain point, the effect is reduced, likely because most of the porous sites available in the filter have been filled with chemistry by the point at which the pressure has been increased.
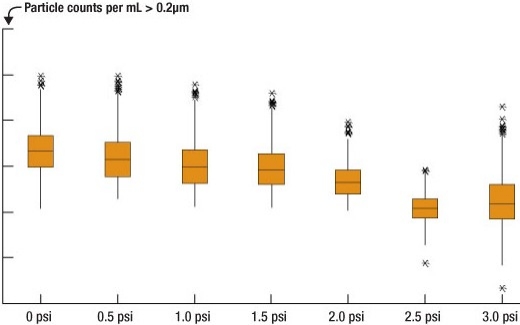 |
| Figure 4. Effect of applying a small amount of positive pressure on TARC chemistry before the dispense nozzle. This test utilizes a 0.1μm UPE filter. |
A two-sample t-test shows statistical significance from one pressure to the next, with the most likely contributor to this effect being the narrowing of the distribution of flyer data points. The greatest effect is seen between 2.0 and 2.5psi.
0.02μm PCM filter. The results of the 0.02μm PCM filter testing are seen in Figure 5. As applied pressure increases, the total number of particle counts decreases and the distribution of particle counts narrows. Again, this effect shows up in a two-sample t-test where statistical significance is shown when comparing one set of particle data to the next. A slight increase in fliers occurs at the 2.0psi rate, but increasing the pressure to 3.0psi shows the best result. This result shows a similar trend to the 0.1μm UPE filter results, proving that the optimal pressure for maximizing microbubble reduction is different for each filter.
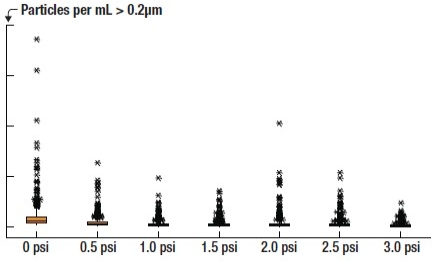 |
| Figure 5. Effect of applying a small amount of positive pressure on TARC chemistry before the dispense nozzle. This test utilizes a 0.02μm PCM filter. |
Conclusion
The introduction of TARC in the lithography process established a means to mitigate interference effects that are caused by topography in full-stack semiconductor processing. The introduction of this chemistry allowed for smaller line widths to be printed, but also created new defect challenges. Lithography equipment engineers have previously addressed many of these challenges; however, new options have become available to provide additional support to reduce defectivity.
In this study, a small amount of pressure was applied to TARC filtrate that had passed through two different filters. It was shown that the correct filter choice would directly affect the level of microbubbles generated during the filtration process. In addition, the application of a small pressure decreased the total count of microbubbles detected by a liquid particle counter, and also narrowed the distribution of particles. This result also showed that the different filters used had different optimal pressure for microbubble reduction.
Acknowledgments
IntelliGen is a registered trademark of Entegris Inc. Minitab is a registered trademark of Minitab Inc. Facility Net is a registered trademark of Particle Measuring Systems Inc.
References
1. D. E.Yount, "Skins of Varying Permeability: A Stabilization Mechanism for Gas Cavitation Nuclei," Accoust. Soc. Am. 65, 1429 (1979).
2. Research on microbubble formation and detection conducted for Mykrolis by CT Associates Bloomington, MN.
3. A. Wu, W. Chow, "A Technique for Rapid Elimination of Microbubbles for Photochemical Filter Startup," Proc. SPIE, 7140, 110 (2008).
4. T. Couteau, M. Carcasi, "Topside Anti-reflective Coating Process and Productivity Improvements on KrF Lithography," Proc. SPIE, 6153, 132 (2006).
5. B. Head, "Spin-on Application of Topside A/R Coatings," Solid State Technology (June, 2003).
6. J. Boski, M. Clarke, Recommendation for Filtration and Dispense of Anti-Reflective Coatings (ARC), Mykrolis Application Note MA074.
7. J. Duffner, Defect Reduction in Top Antireflective Coating, Mykrolis Applications Note AN1019ENUS.
Biography
Jennifer Braggin received her Master of Science degree in engineering science from Rensselaer Polytechnic Institute and her Bachelor of Science degree in materials science and engineering from Lehigh U., and is the dispense products applications engineer at Entegris, Inc., 129 Concord Road, Billerica, MA 01821 USA; e-mail [email protected].

