|
In the future, the production of advanced LED structures is expected to grow more rapidly with the growth in energy efficient, long-lifetime luminaries for general lighting applications. In this article, we will outline the most important measurement capabilities that allow the rapid and reliable control of the LED production process using HRXRD, and the latest advances in HRXRD technology to allow true in-line monitoring. This article includes a video interview with Jordan Valley Semiconductors from SEMICON West 2010. |
Paul Ryan, John Wall, Richard Bytheway, David Jacques, Kevin Matney, Qu Bo, Jordan Valley Semiconductors UK Ltd, Belmont, Durham, UK
Key parameters for the quality of advanced LEDs are the wavelength and brightness of the emitted light. Several structural parameters control these aspects, and these have traditionally been determined using high resolution X-ray diffraction (HRXRD).
A typical HB-LED structure is based on III-nitride materials and is dominated by a repeating unit of InGaN and GaN layers. These two, thin layers are repeated several times (typically between five and 10 repeat units) to create a multi-quantum well (MQW). This MQW is the heart of the LED structure, and the details of the MQW structure determined using HRXRD play a key role in the success of the device. In particular:
1. The In composition within the InGaN layer, along with the number of repeats within the MQW, the wavelength of the light can be controlled;
2. The repeatability of the thickness of each layer within the stack is critical for efficient MQW structures; and
3. The mosaic tilt and twist of the structure controls the efficiency and yield of the device
In this video from SEMICON West, Isaac Mazor, Jordan Valley Semiconductors, talks about LED structures and the LED market: the green/eco drivers, high investment in capacity, energy savings, etc. LED applications go side-by-side with semiconductor fab applications.
Measurement of In composition and MQW thickness
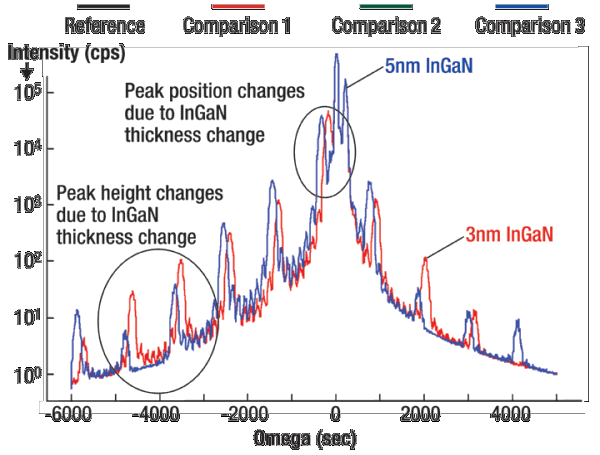
A perfect LED structure, with a MQW repeat of 15nm and a 15% In composition, would give a HRXRD pattern as shown in Fig. 1. The general diffracted intensity consists of a narrow, intense peak from the GaN buffer layer (centered at 0s in the figure), another peak to slightly higher angle of the GaN, which is attributed to the AlGaN layer. The position of this peak is related to the Al content within the AlGaN layer, and the height, and width, of this peak is related to the thickness of the AlGaN layer.
 |
| Figure 1. The effect on the HRXRD spectrum by varying just the InGaN layer thickness. |
The series of peaks from the MQW structure give a large amount of information about the layer thicknesses and composition within the MQW:
1. Satellite period gives the combined thickness of the InGaN and GaN (bilayer repeat thickness); and
2. The position of main MQW peak gives the average In composition within the InGaN / GaN pair (note, this is not the In composition within the InGaN layer).
To determine the actual In composition within the InGaN layer, a number of other factors must be considered, namely the individual InGaN and GaN layer thicknesses within the MQW, and the relaxation of the MQW structure relative to the GaN buffer layer. We will consider the case where the layers are assumed to be relaxed, as is often historically assumed within production.
There are two main affects on the data when the InGaN thickness is changed, as shown in Fig. 1. First, the MQW to substrate peak separation increases, as the average composition within the MQW has increased by increasing the InGaN thickness relative to the total GaN + InGaN thickness. Second, the period of the satellite peaks remains unchanged, but the ratio of peak heights varies with the InGaN thickness. Therefore, to enable the InGaN layer thickness, and hence the In composition, the data must cover several satellite peaks and the simulation software must accurate fit to the satellite peaks over a wide angular range. It should be apparent that a high intensity incident beam and low baseline is required in order to reliably determine these key structural parameters.
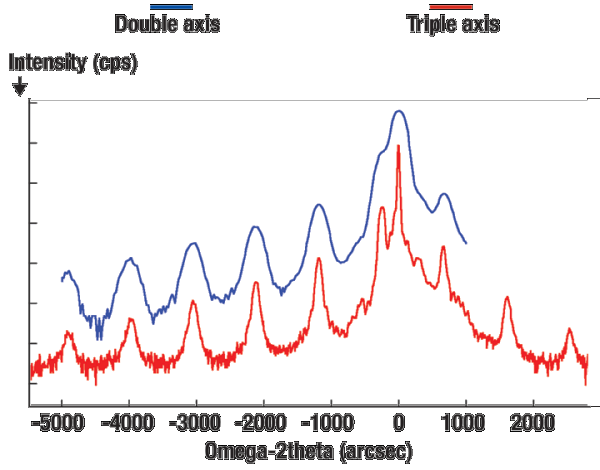
In the examples above, the structures are assumed to be structurally perfect. However, the growth of GaN is typically dominated by a mosaic structure. This mosaic structure has a major influence on the HRXRD spectrum. The peaks are broadened as the mosaic tilt essentially smears out the details of the diffraction pattern. This leads to the main MQW peak being merged into the main GaN peak, as shown in the blue spectrum in Fig. 2, preventing accurate analysis of the In composition. However, the data is still suitable for bilayer thickness analysis.
 |
| Figure 2. Comparison of HRXRD spectra collected with and without triple axis analyzer crystal, from an MQW structure with mosaic tilt. |
To enable accurate and precise measurements of the key MQW parameters the influence of the mosaic tilt must be minimized within the HRXRD data. This is achieved by inserting an analyzer crystal in front of the detector in order to improve the angular resolution of the measurement without substantially reducing the intensity. This then allows high-quality diffraction data to be obtained, as seen in the red spectrum (Fig. 2). Advances in X-ray measurement techniques allow these measurements and automated analysis to be performed in a few seconds on production HRXRD monitoring systems, such as the QC3 tool.
Traditionally, HRXRD has often been used for process development applications using a traditional R&D diffractometer, typically requiring a manual configuration of the system with long data collection times and tedious analysis of the data. However, dedicated production optimized HRXRD systems are now available that have specifically designed to address many of these issues at a low cost of ownership. The QC3 system, for example, allows triple axis scans to be performed in less than one minute. It allows for automated configuration of the system, wafer alignment and full structural analysis in parallel with subsequent measurements. Results can be output in a variety of formats and customized for statistical process control SPC.
Conclusion
For the accurate determination of In composition, and hence wavelength, high quality diffraction data with high intensity, low background that span wide angular ranges are necessary, and full dynamical simulation is required for detailed analysis. This requires a high intensity source with a high dynamic range detector.
The latest generation of HRXRD tools specifically for production monitoring are designed to be able to determine the key structural parameters for LED analysis on multiple wafers in a single batch run, with a simple user interface suitable for a production environment.
Biographies
Paul Ryan received his BSc and PhD from the U. of Leeds, UK and is VP Corporate and UK Site Manager at Jordan Valley Semiconductors UK Ltd, Belmont Business Park, Belmont, Durham, UK; ph.: +44 191 332 4700; email [email protected].
John Wall is R&D Manager at Jordan Valley Semiconductors UK Ltd.
Richard Bytheway received his BSc from the U. of Wales, Swansea, UK and is a technologist at Jordan Valley Semiconductors UK Ltd.
David Jacques received his D.E.A and Diplome d’Ingénieur from Institut National des Sciences Appliquées de Toulouse and is a product manager at Jordan Valley Semiconductors UK Ltd.
Kevin Matney received his BS and MS from UCLA and is a senior technologist at Jordan Valley Semiconductors Inc.
Qu Bo received his PhD from the Institute of Semiconductors, CAS and is a regional applications manager for Asia at Jordan Valley Semiconductors UK Ltd.
More Solid State Technology Current Issue Articles
More Solid State Technology Archives Issue Articles

