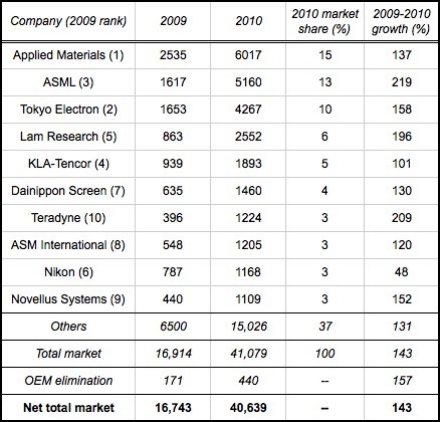
April 11, 2011 – Global semiconductor capital equipment spending raced ahead 143% in 2010 to $41.08B (including some OEM contributions), according to Gartner. Sales growth was slightly better for wafer-fab equipment (WFE, 145%) and automated test equipment (ATE, 149%), and slightly less for packaging/assembly equipment (PAE, 127%). Top growth goes to litho supplier ASML (219% growth to $5.16B), followed by test supplier Teradyne (209% growth to $1.22B) and etch stalwart Lam Research (196% to $2.55B).
(The numbers are largely in line with what VLSI Research reported recently, though the Gartner numbers show some differences further down the list: Nikon at No.9 [VLSI showed Nikon slipping off its top-10 list] and Novellus at No.10 [ranked ninth by VLSI].)
Some key trends illustrating capital spending in the year 2010:
Technology, then capacity. Why was 2010 such a good year? Because it managed to incorporate both drivers of capital equipment spending, according to Klaus Rinnen, Gartner managing VP, in a statement. Those with memory and foundry exposure also did particularly well.
Litho: A double-patterned sword. ASML hiked up the list thanks to demand for immersion lithography systems for double patterning, increasing to 13% market share overall. However, "strength in double patterning benefited some companies more than others," Rinnen noted. (Hello, Nikon.)
Big get bigger. Applied Materials more than doubled sales in 2010 to top $6.0B — but still couldn’t pick up market share, as other sectors (e.g. litho) expanded more rapidly. For the same reason, TEL dropped a spot to No.3 despite its dominance in track, and also thanks to "relatively slower spending by some of its key customers," Rinnen noted. Overall, though, the top 10 suppliers picked up nearly two points to account for 63.4% of total revenue.
 |
| Top 10 companies’ revenue from shipments of total semiconductor equipment, worldwide (in US $M). (Source: Gartner) |
Clearly the massive and tragic earthquake + tsunami disaster in Japan is having a near-term impact on many industries, including semiconductors, for two main reasons: lack of reliable infrastructure/power, and shortages of components and materials (e.g. BT resin and silicon). This will be a challenge in the coming few months, but "semiconductor equipment manufacturers should be able to recover in the second half of the year," Gartner thinks.
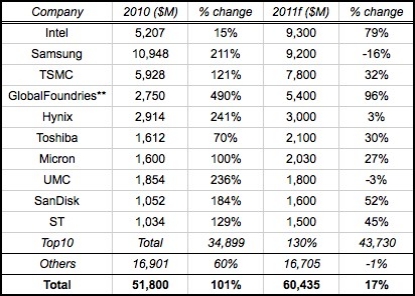
In fact, another analyst firm thinks 2011 will raise the capex roof significantly vs. 2010 even taking the Japanese disaster into account. IC Insights has boosted its capex forecast to 17% ($60.4B), and then even higher in 2012 to $63.3B. Foundries will be adding manufacturing lines and technology upgrades in response to more business from IC suppliers, and memory suppliers simply need to relentlessly push to the next process geometries.
It’s worth noting that every cent of capex growth in 2011 is coming from the top-10 spenders: 25% growth to $43.7B, vs. a -1% decline in spending from everyone else. Note that Samsung, whose jaw-dropping $10.9B spending in 2010 was more than a fifth of total semiconductor spending — and nearly that of Intel and TSMC combined — will pull back to "only" $9.2B in 2011, with 56% of that going to memory (vs. 71% in 2010). Put those together and Samsung is shelling out more than $20B in two years — equivalent to five leading-edge 300mm wafer fabs ($4B a pop).
While the numbers for 2010 seem massive, IC Insights thinks it wasn’t excessive spending, as most of it was for technology-ramping rather than capacity additions. Capex as a percentage of sales was just 16%, the second-lowest on record; 2011 capex/sales will be just 17%, IC Insights forecasts. (For reference, capex/sales was around 26% in the late ’90s and through the 2001 downturn, and ~20% from 2003-2009.) The firm projects this low spending ratio will continue through 2012 and beyond, at 14%-17% capex/sales over the next five years.
 |
| 2011 top spenders’ semiconductor capital spending (including company’s share of joint-venture spending). **Includes Chartered for 2010. (Source: IC Insights, company reports) |

