Marty Mason, Vantage Technology Corp.
June 2, 2011 — Leading IC manufacturers and semiconductor equipment companies are generating concerted efforts to improve the metrics, standards and quality control (QC) parameters for chemical mechanical polishing (CMP) slurry. Following more than 10 years of proprietary slurry recipe formulations, along with a dilution-sampling methodology for monitoring slurry quality, IC manufacturers are calling for product quality improvement, slurry measurement standardization, and better alignment between metrologies and CMP production conditions.
 |
|
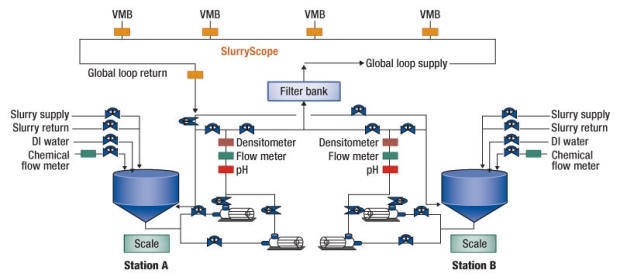
Figure 1. Configuration to correlate LPC to wafer CMP results. Establish LPC and wafer performance characteristics and correlations. Determine GL circulation effects on LPC values as a batch is consumed at the POU. SOURCE: Vantage Technology |
At a recent CMP User conference, an industry spokesperson from a major chip maker said that the industry needs to move away from slurry dilution measurements, as they are not representative of the slurry condition during chemical mechanical planarization on-wafer results, and change the slurry condition [1]. Various issues with CMP slurry performance and related slurry quality drive demand for better metrology and testing. Tracking the difference between "as delivered" slurry at the fab-tank level, versus the "on-wafer quality" and results of the slurry on CMP wafers, is at the heart of the concern. Moving the slurry around the slurry delivery lines from sub-fab to CMP tools in the fab (Fig. 1) requires pumping, valves and shear stress that cause particle agglomeration — which in turn can cause scratching excursions.
According to studies on slurry handling in preparation for CMP processing, "Slurry turnovers through bulk slurry dispense systems and through fab piping will experience ~100 turnovers before being consumed." (R.K. Singh, from ref. #2) [2]. But the traditional use of slurry particle sensors that require dilution ratios as high as 20,000:1 to effectively measure the densely packed slurry particles has resulted in numerous diversions between the monitored slurry-sample test conditions and what is actually happening to the slurry used by CMP on the wafer. These dilution sensors are not measuring the slurry in the same conditions experienced by the wafer during CMP.
Slurry sampling and dilution for particle measurement effectively masks out the largest particle size bins, which are the most likely to cause scratching. The statistical probability for finding a few large particles when using only a few micro liters of slurry mixed with >1000× the volume of DI water (DIW) reduces large particle count (LPC) visibility to near-zero. Also, slurry dilution can affect its pH, its zeta potential, and can affect the iso electric point (IEP) — all factors in how much slurry tends to agglomerate or form larger, damaging particles. As presented in ref. #3, by Dr. Yuzhou Li, Ph.D, "Agglomerated particles may contribute to higher defectivity and yield loss in the CMP process. In general the chemical composition of slurries maintains a high repulsive electrostatic surface charge on abrasive particles to resist agglomeration. Aggressive handling may cause shear to the slurry abrasives due to strong velocity gradients produced by slurry flow by suddenly changing flow path and geometry [3]."
IC manufacturers need CMP slurry to perform consistently during the wafer polishing process, and to that end, they are pushing for improved slurry metrics. Only recently, new particle measurement units been developed that can monitor particles of undiluted slurry. In the past year, metrology system providers have developed new techniques that enable undiluted testing of slurries for both the LPC (i.e., >1.0µm) and the mean particle size of the slurry abrasives. Mean-sized particles — usually well below 100nm — are the slurry’s primary abrasives, with a tight distribution to control removal rates (RR). The LPC is associated with defects and scratching, because it is not considered to be part of the intended slurry composition, but can impact wafer polishing. Figures 2 & 3 show slurry particles in the LPC range measured down to a cutoff point with undiluted testing.
 |
|
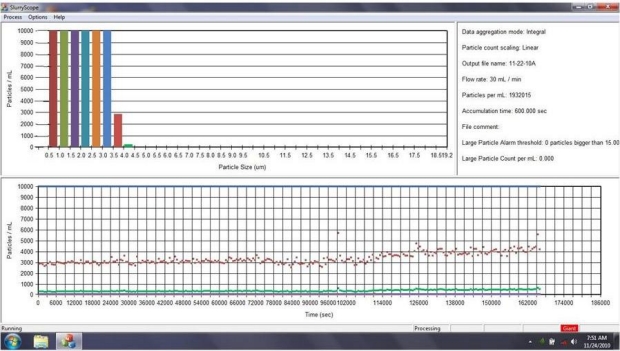
Figure 2. LPC cutoff ceria monitor >40hrs (SlurryScope data of undiluted measurements of slurry LPC). SOURCE: Vantage Technology |
Figure 2 shows a graph of undiluted ceria slurry with the cutoff point where the slurry LPC reaches zero. The bars in the upper graph show particle size bins from 1.0µm and above, with the last two bins of 3.5-4.0µm (brown) and 4.0-4.5µm (green). The bottom graph is a time-line display (with the beginning of the test — time 0 at far right) of those two size bins over the >40 hour period of monitoring. The improvement or reduction in both size bins was the result of a new filter installation in slurry delivery line (note the drop in counts for both colors).
 |
|
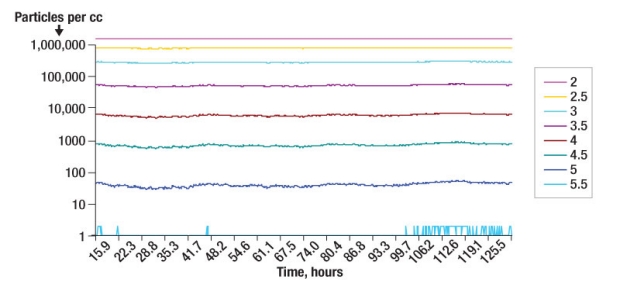
Figure 3. Ceria delivery monitor >120hrs. (SlurryScope data of undiluted extended run measurements of slurry LPC). SOURCE: Vantage Technology |
Figure 3 shows longevity testing of ceria slurry over more than 120 hours with continuous monitoring of the size bins from 2.0 to 5.5µm, with the 5.5µm size just barely visible at the bottom of the graph. This is an example of undiluted slurry particle size distribution (PSD) measurement where the actual tail of curve can be tracked to zero — by comparison, the dilution sensor results are masked in size bins with smaller counts.
Other important parameters for controlling slurry quality, and thus predicting or improving CMP processing, include quantification of slurry reaction to induced shear-stress, and impact to the changes in zeta potential. Such test procedures are difficult to perform with controlled data comparisons. Modeling of a particular fab’s slurry delivery system to calculate the quantified shear-stress induced on slurry before it is deposited on the wafer is just one factor. Deciding on how to emulate and simulate the degree of shear-stress on new slurry during manufacturing is a significant obstacle for slurry developers or customers to test. However, it is this understanding of how slurry agglomerates with these handling forces that will enable the development of slurries with greater tolerance to shear-stress.
 |
|
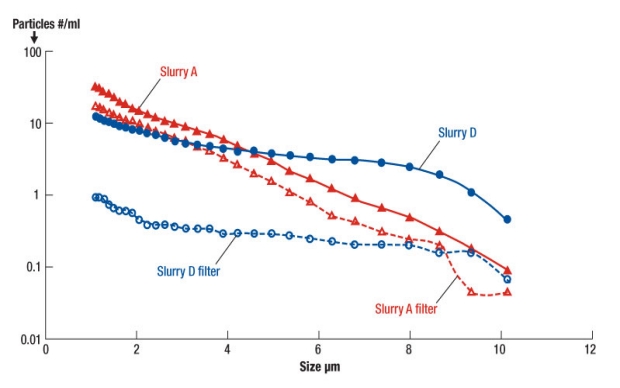
Figure 4. Effects of filters on particle measurement. SOURCE: Vantage Technology |
Already, multiple IC manufacturers and CMP equipment companies are beginning to collect the data on a variety of slurries either at the slurry delivery and dispense point, or by starting to monitor the slurry in situ as delivered to the CMP system. Figure 4 shows the undiluted comparison of two different slurries before and after filtering. By monitoring post filter slurry PSD, it is possible to track the performance of the reduction in LPC and replace filters based on actual data. This represents another benefit to slurry quality at the CMP tool, rather than having to just change out filters on a recommended cycle basis.
Conclusion
Ultimately, the goal of measuring and tracking slurry particle distributions is to improve CMP results consistency, alert on or eliminate LPC growth that can cause defects, and minimize the cost impact to CMP systems by reducing lost utilization time to scratch excursions.
References:
1. "Characterization of abrasive particle distribution in CMP slurries," presented at Levitronix CMP Users Conference, Dallas, TX USA, May 11-12, 2011.
2. R.K. Singh, "CMP Slurry Metrology Characterization," 2007; Microelectronic Applications of Chemical Mechanical Planarization; p. 580; John Wiley & Sons, Inc.
3. Dr. Yuzhuo Li, Ph.D., Editor; Microelectronic Applications of Chemical Mechanical Planarization; "CMP Slurry Metrology Distribution and Filtration," p. 574; 2008 John Wiley & Sons, Inc.
Marty Mason received his BS from the US Naval Academy, and MBA from the U. of Santa Clara and is VP of Sales & Marketing at Vantage Technology Corp., 1731 Dell Avenue, Campbell, CA 95008 USA; ph.: 1-408-866-8522; [email protected]
Also read: The rule of three for CMP by Michael A. Fury, Techcet
Subscribe to Solid State Technology/Advanced Packaging.
Follow Solid State Technology on Twitter.com via editors Pete Singer, twitter.com/PetesTweetsPW and Debra Vogler, twitter.com/dvogler_PV_semi.

