
Tom Ho and Stewart Chalmers, BISTel, Santa Clara, CA
Traditional FDC systems collect data from production equipment, summarize it, and compare it to control limits that were previously set up by engineers. Software alarms are triggered when any of the summarized data fall outside of the control limits. While this method has been effective and widely deployed, it does create a few challenges for the engineers:
- The use of summary data means that (1) subtle changes in the process may not be noticed and (2) the unmonitored section of the process will be overlooked by a typical FDC system. These subtle changes or the missed anomalies in unmonitored section may result in critical problems.
- Modeling control limits for fault detection is a manual process, prone to human error and process drift. With hundreds of thousandssensors in a complex manufacturing process, the task of modeling control limits is extremely time consuming and requires a deep understanding of the particular manufacturing process on the part of the engineer. Non-optimized control limits result in misdetection: false alarms or missed alarms.
- As equipment ages, processes change. Meticulously set control limit ranges must be adjusted, requiring engineers to constantly monitor equipment and sensor data to avoid false alarms or missed real alarm.
Full sensor trace detection
A new approach, Dynamic Fault Detection (DFD) was developed to address the shortcomings of traditional FDC systems and save both production time and engineer time. DFD takes advantage of the full trace from each and every sensor to detect any issues during a manufacturing process. By analyzing each trace in its entirety, and running them through intelligent software, the system is able to comprehensively identify potential issues and errors as they occur. As the Adaptive Intelligence behind Dynamic Fault Detection learns each unique production environment, it will be able to identify process anomalies in real time without the need for manual adjustment from engineers. Great savings can be realized by early detection, increased engineer productivity, and containment of malfunctions.
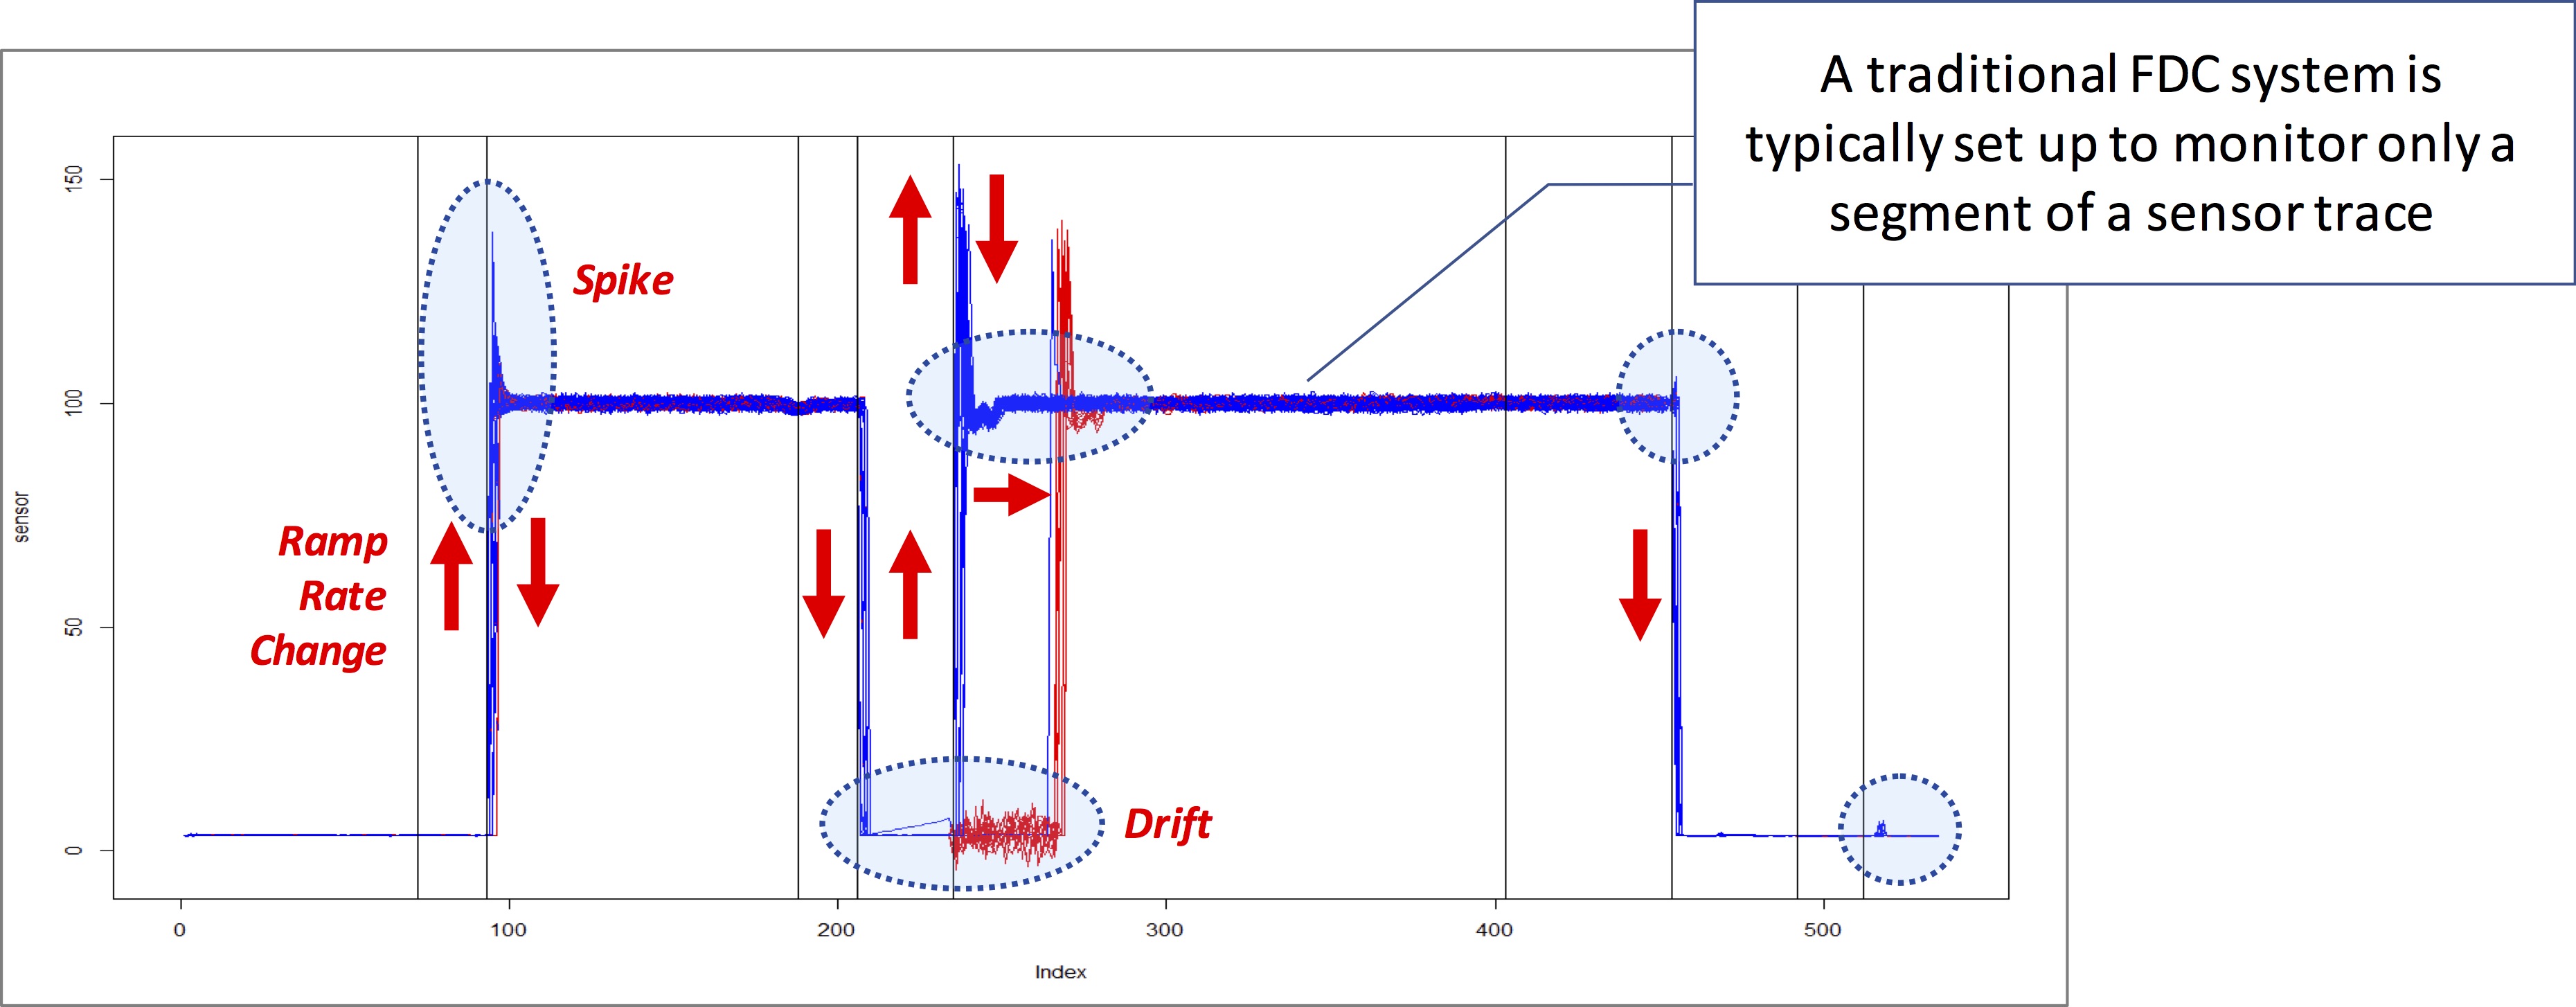
DFD’s strength is its ability to analyze full trace data. As shown in FIGURE 1, there are many subtle details on a trace, such as spikes, shifts, and ramp rate changes, which are typically ignored or go undetected by a traditional FDC systems, because they only examine a segment of the trace- summary data. By analyzing the full trace using DFD, these details can easily be identified to provide a more thorough analysis than ever before.
Dynamic referencing
Unlike traditional FDC deployments, DFD does not require control limit modeling. The novel solution adapts machine learning techniques to take advantage of neighboring traces as references, so control limits are dynamically defined in real time. Not only does this substantially reduce set up and deployment time of a fault detection system, it also eliminates the need for an engineer to continuously maintain the model. Since the analysis is done in real time, the model evolves and adapts to any process shifts as new reference traces are added.
DFD has multiple reference configurations available for engineers to choose from to fine tune detection accuracy. For example, DFD can 1) use traces within a wafer lot as reference, 2) use traces from the last N wafers as reference, 3) use “golden” traces as reference, or 4) a combination of the above.
As more sensors are added to the Internet of Things network of a production plant, DFD can integrate their data into its decision-making process.
Optimized alarming
Thousands of process alarms inundate engineers each day, only a small percentage of which are valid. In today’s FDC systems, one of the main causes for false alarms is improperly configured Statistical Process Control (SPC) limits. Also, typical FDC may generate one alarm for each limit violation resulting in many alarms for each wafer process. DFD implementations require no control limits, greatly reducing the potential for false alarms. In addition, DFD is designed to only issues one alarm per wafer, further streamlining the alarming system and providing better focus for the engineers.
Dynamic fault detection use cases
The following examples illustrate actual use cases to show the benefits of utilizing DFD for fault detection.
Use case #1 – End Point Abnormal Etching
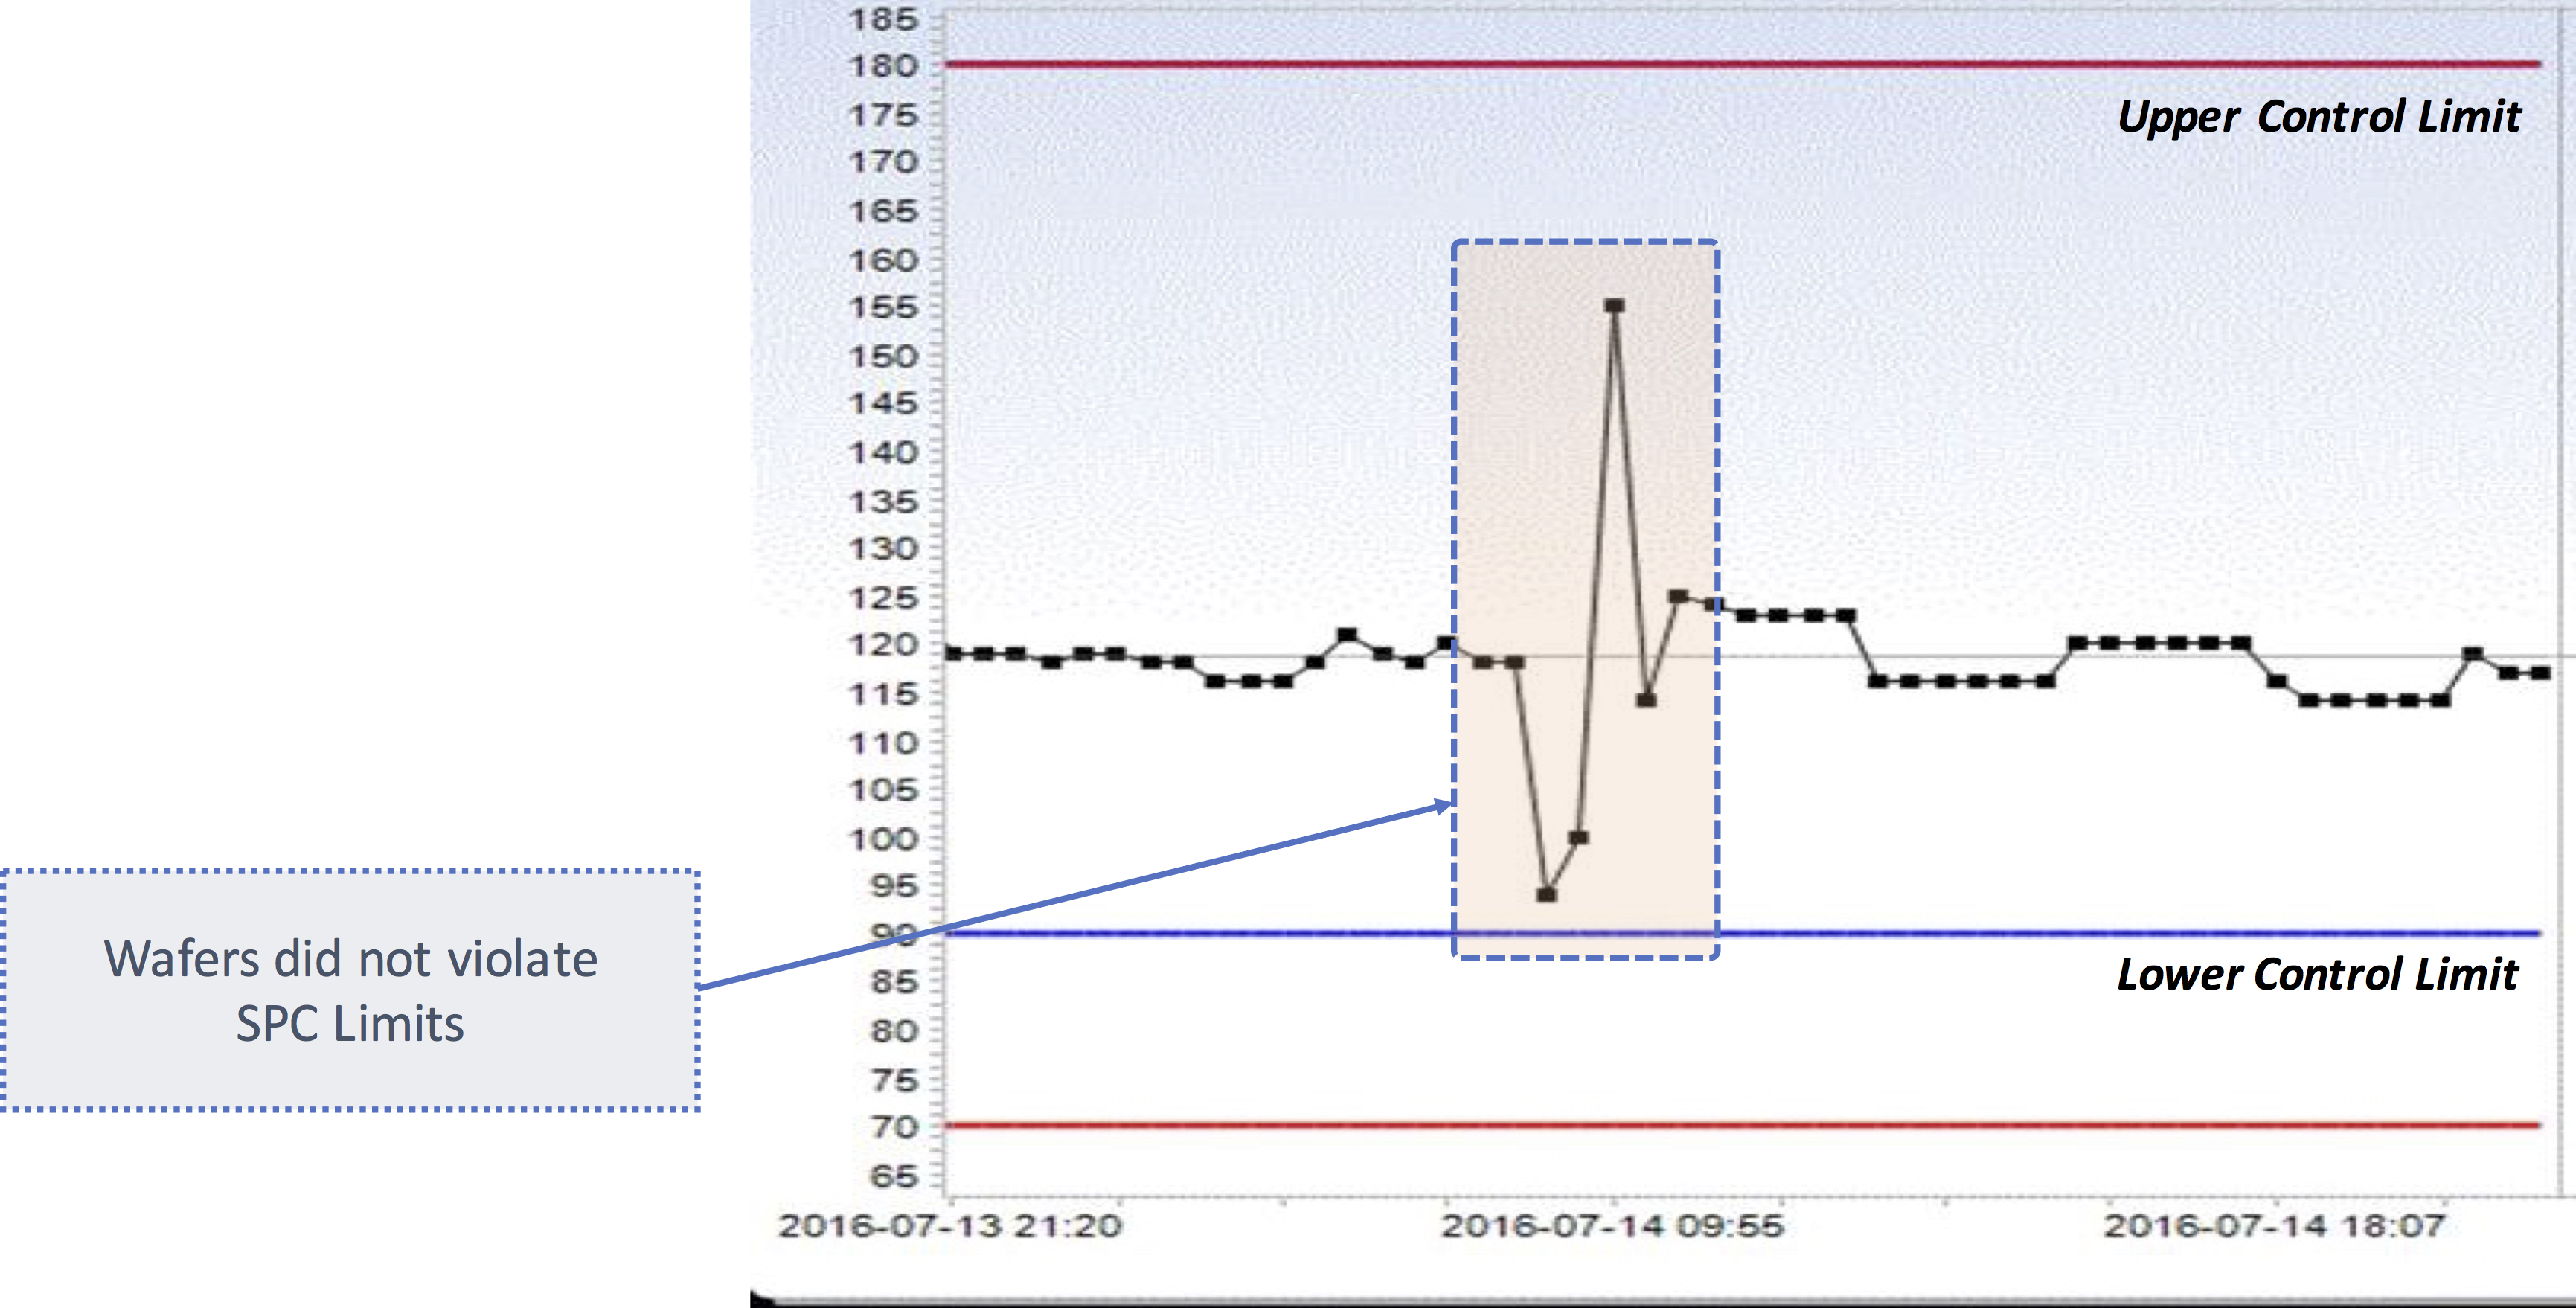
In this example, both the upper and lower control limits in SPC were not set at the optimum levels, preventing the traditional FDC system from detecting several abnormally etched wafers (FIGURE 2). No SPC alarms were issued to notify the engineer.
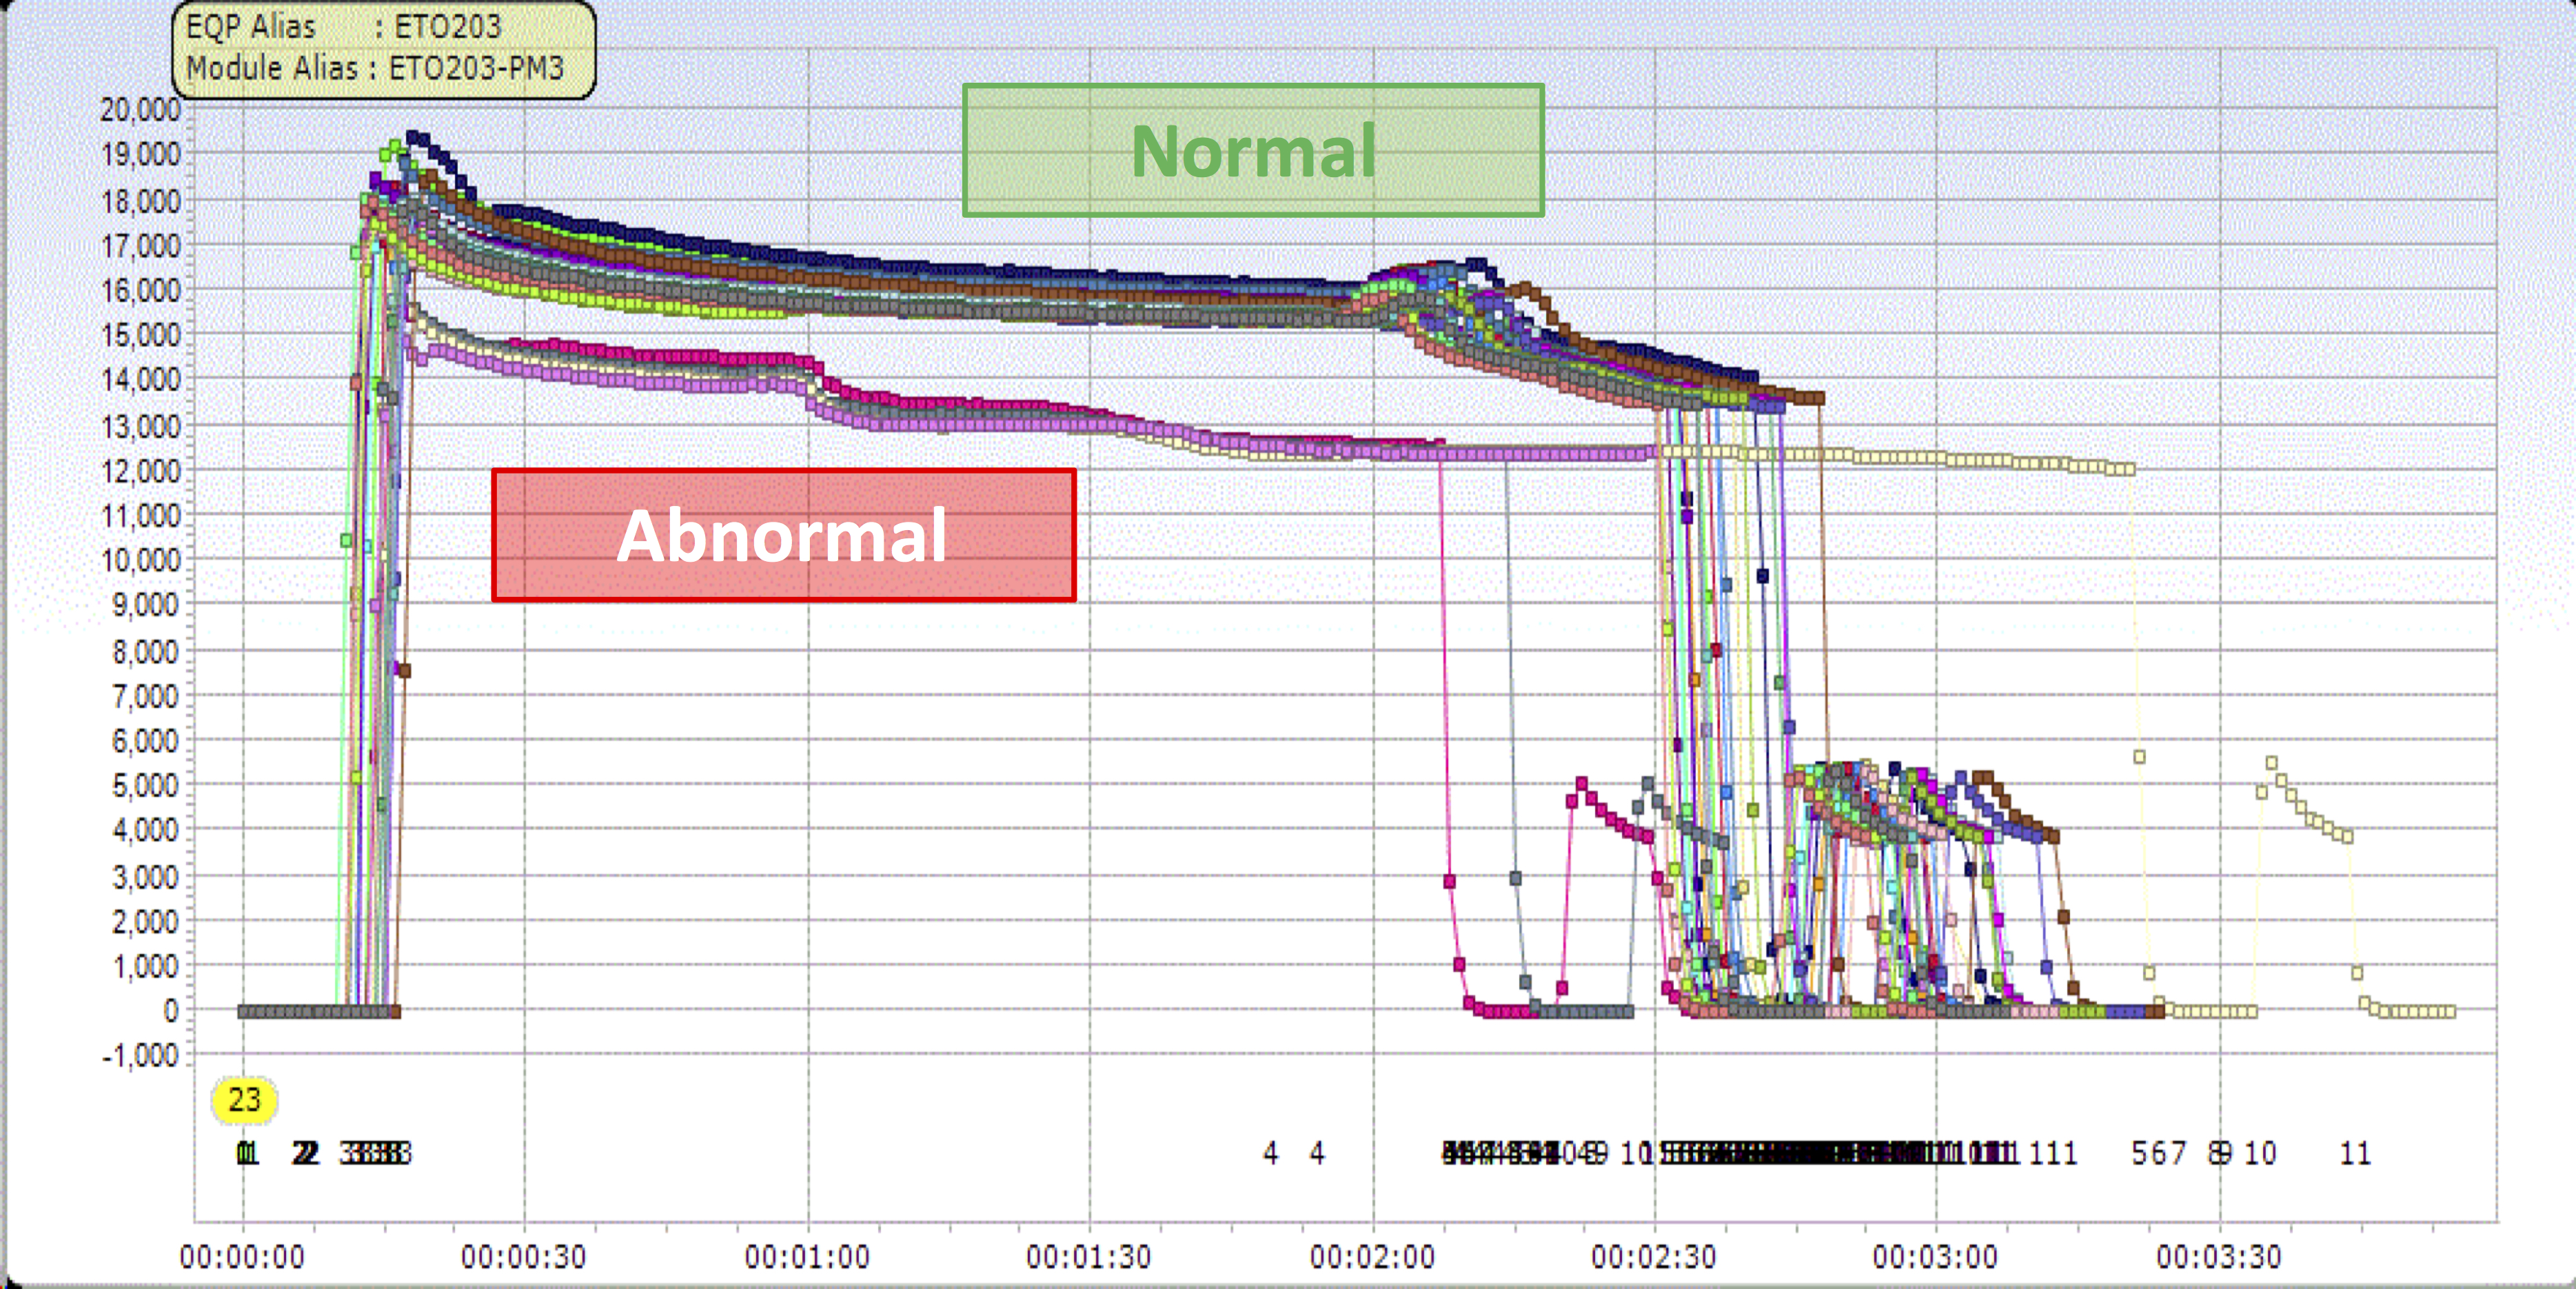
On the other hand, DFD full trace comparison easily detects the abnormality by comparing to neighboring traces (FIGURE 3). This was accomplished without having to set up any control limits.
Use case #2 – Resist Bake Plate Temperature
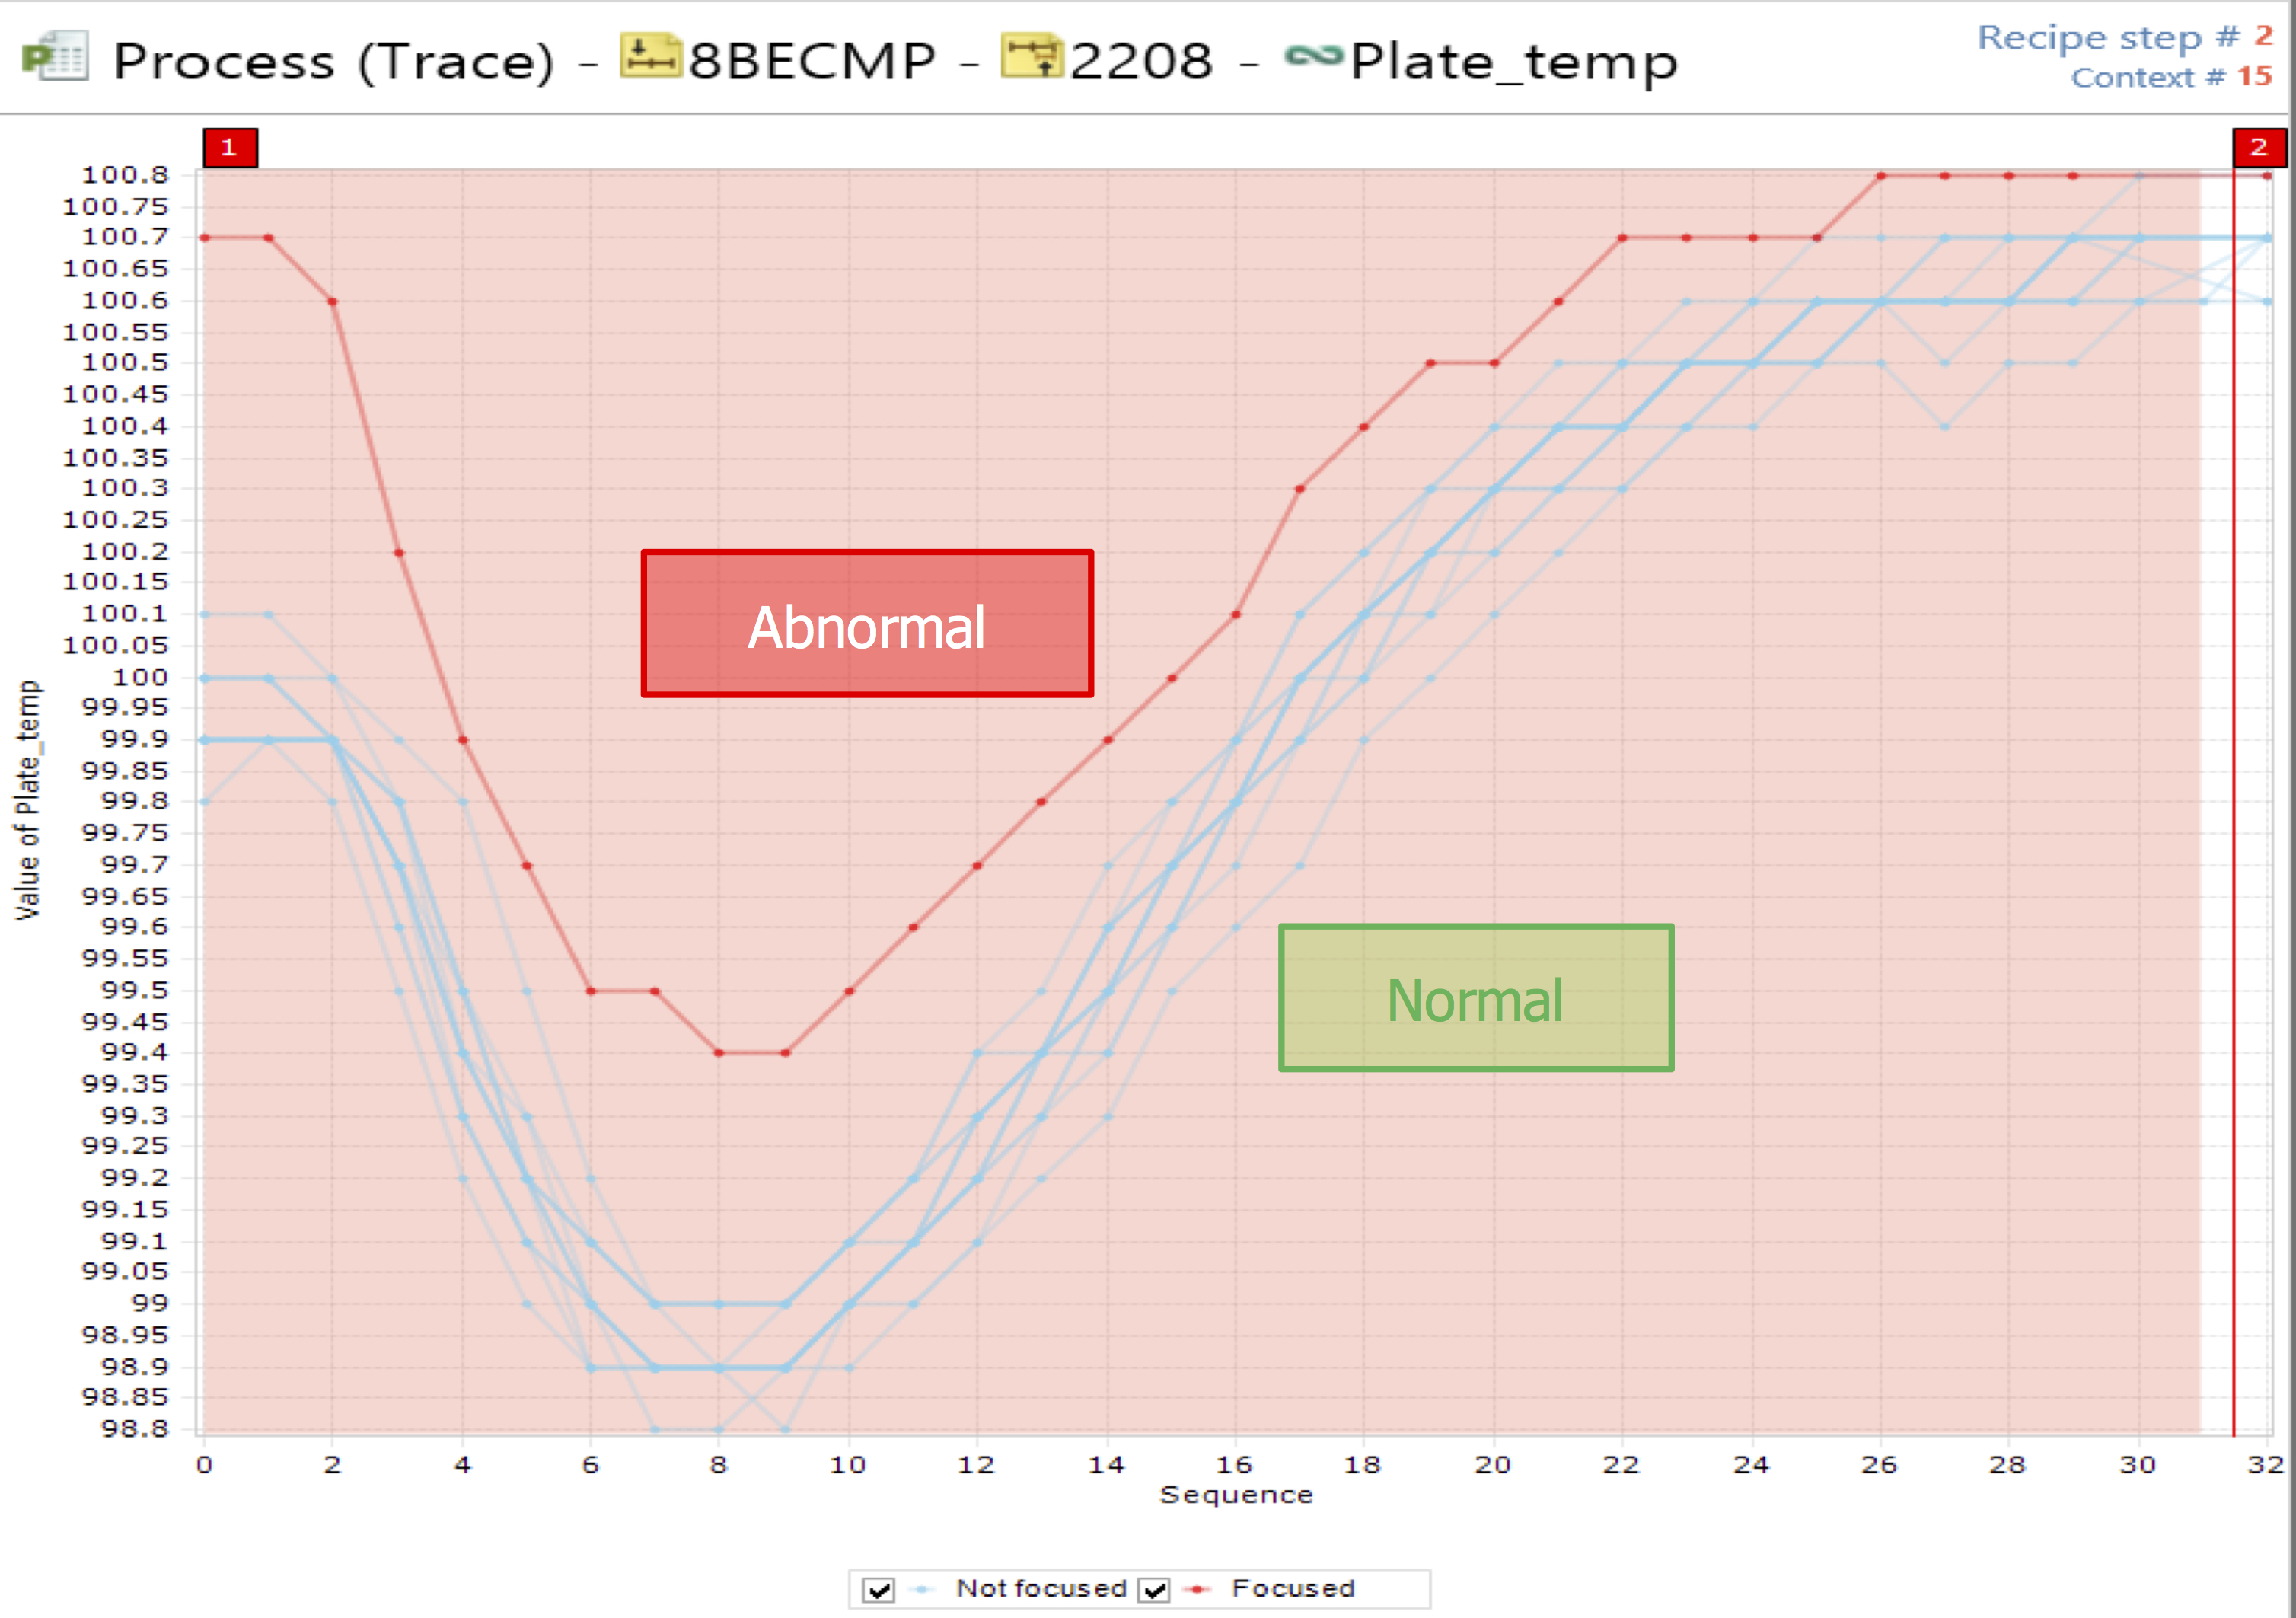
The SPC chart in Figure 4 clearly shows that the Resist bake plate temperature pattern changed significantly; however, since the temperature range during the process never exceeded the control limits, SPC did not issue any alarms.

When the same parameter was analyzed using DFD, the temperature profile abnormality was easily identified, and the software notified an engineer (FIGURE 5).
Use case #3 – Full Trace Coverage
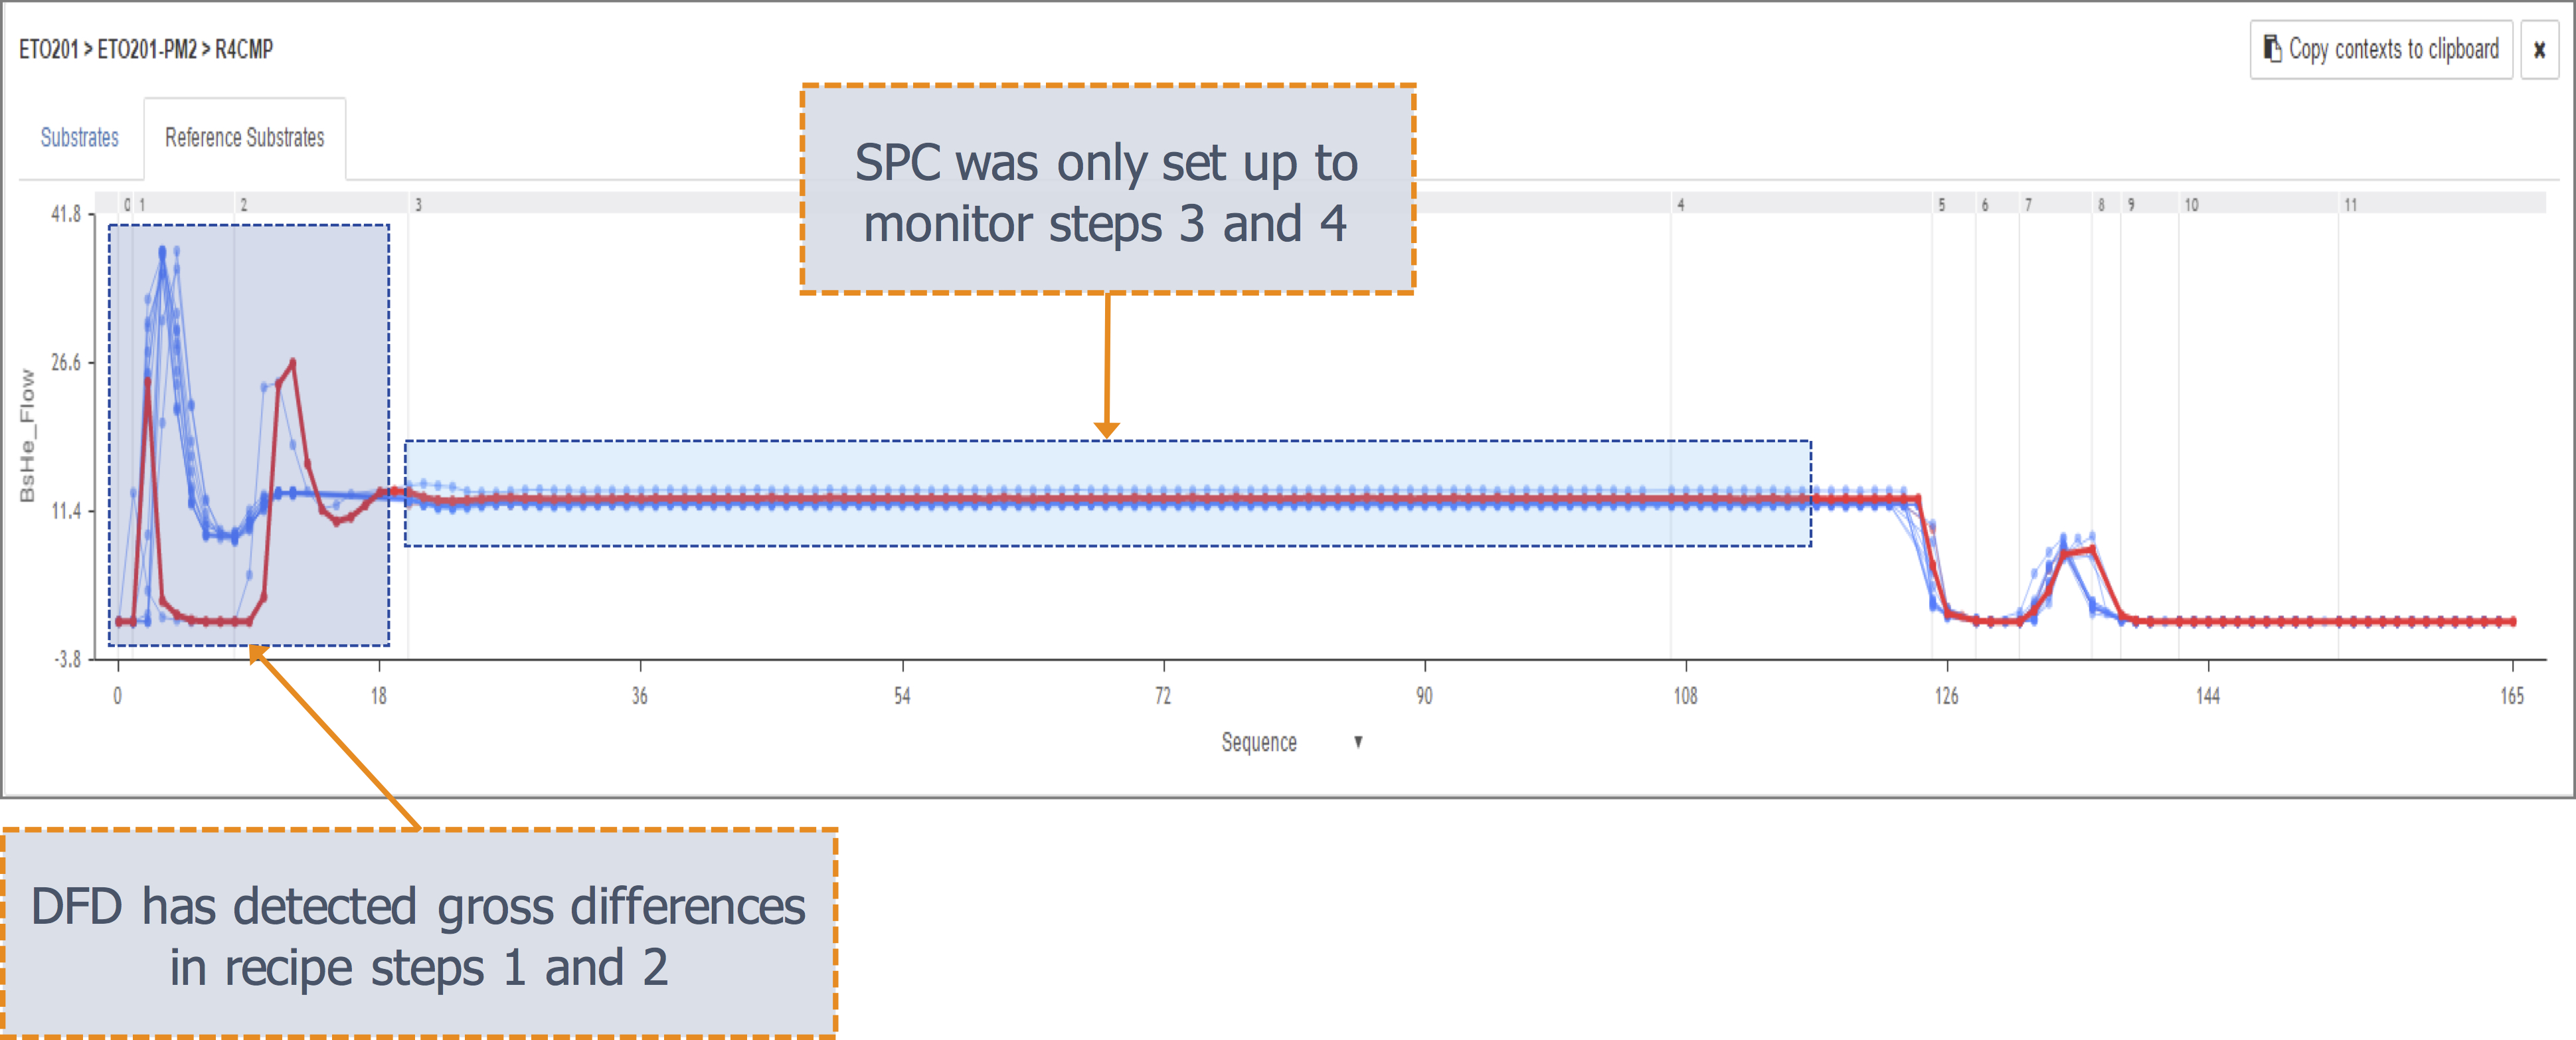
Engineers select only a segment of sensor trace data to monitor because setting up SPC limits is so arduous. In this specific case, the SPC system was set up to monitor only the He_Flow parameter in recipe step 3 and step 4. Since no unusual events occurred during those steps in the process, no SPC alarms were triggered.
However, in that same production run, a DFD alarm was issued for one of the wafers. Upon examination of the trace summary chart shown in FIGURE 6, it is clear that while the parameter behaved normally during recipe step 3 and step 4, there was a noticeable issue from one of the wafers during recipe step 1 and step 2. The trace in red represents the offending trace versus the rest of the (normal) population in blue. DFD full trace analysis caught the abnormality.
Use case #4 – DFD Alarm Accuracy
When setting up SPC limits in a conventional FDC system, the method of calculation taken by an engineer can yield vastly different results. In this example, the engineer used multiple SPC approaches to monitor parameter Match_LoadCap in an etcher. When the control limits were set using Standard Deviation (FIGURE 7), a large number of false alarms were triggered. On the other hand, zero alarms were triggered using the Mean approach (FIGURE 8).

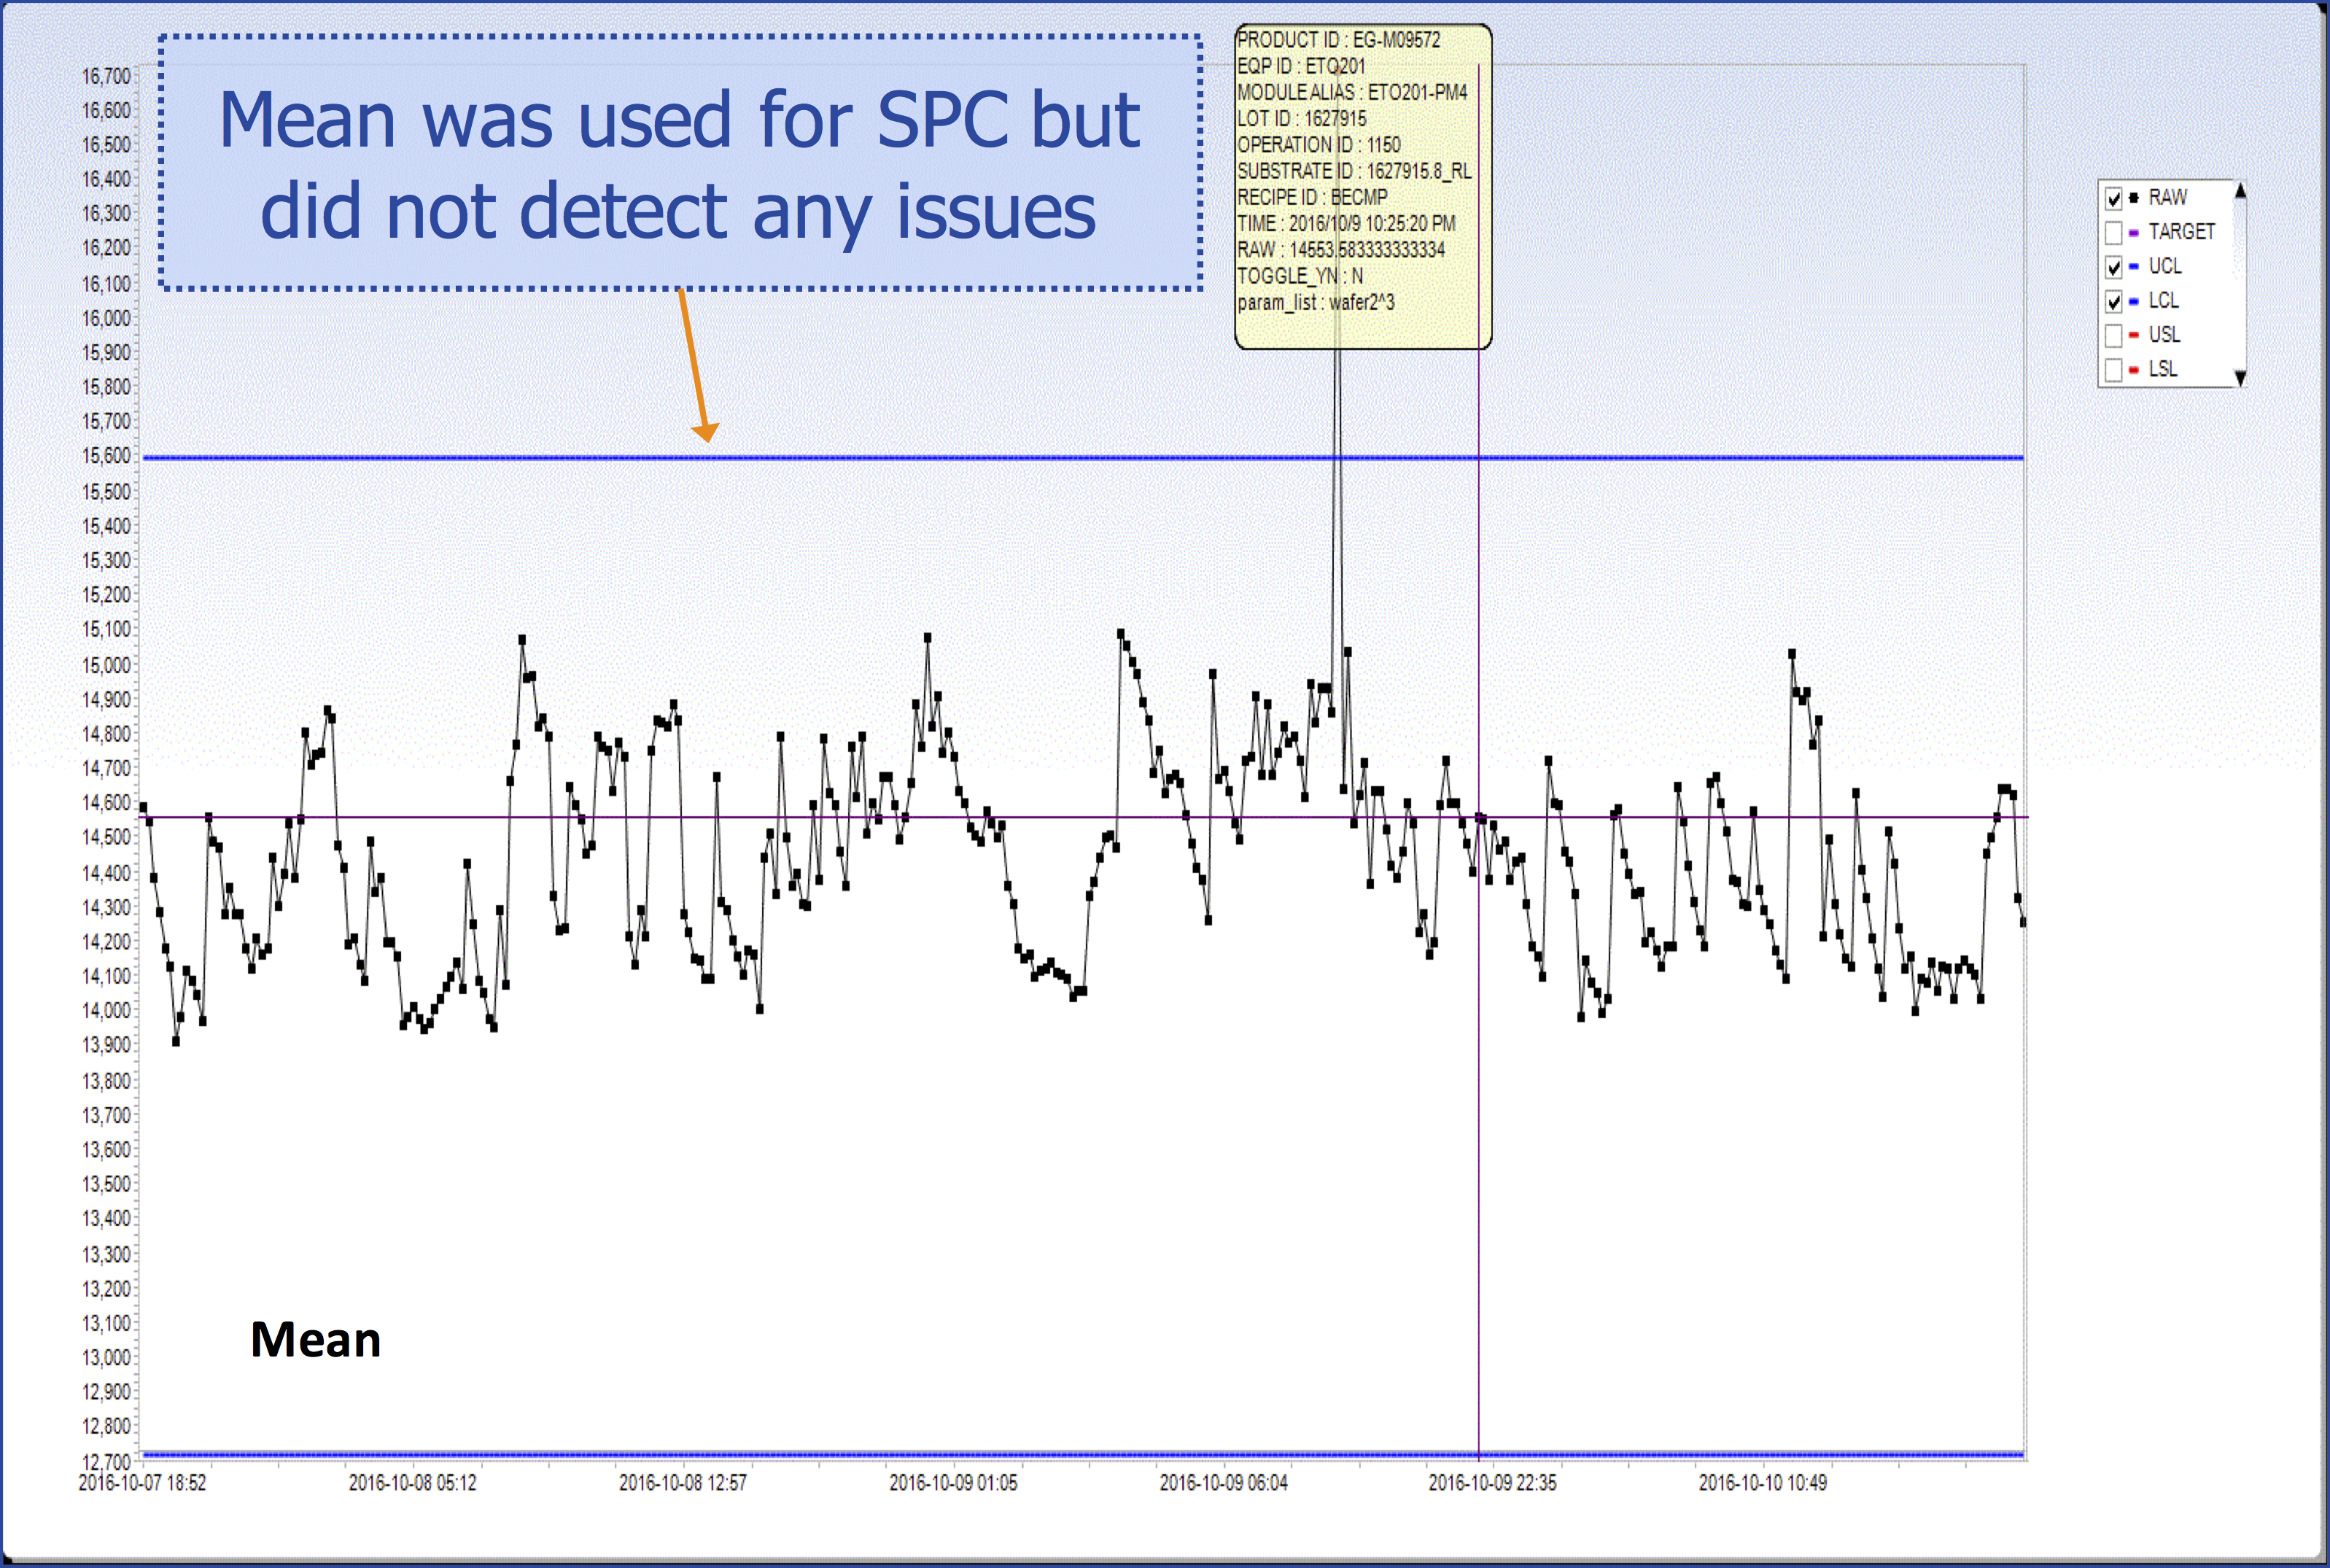
Using DFD full trace detection eliminates the discrepancy between calculation methods. In the above example, DFD was able to identify an issue with one of the wafers in recipe step 3 and trigger only one alarm.
Dynamic fault detection scope of use
DFD is designed to be used in production environments of many types, ranging from semiconductor manufacturing to automotive plants and everything in between. As long as the manufacturing equipment being monitored generates systematic and consistent trace patterns, such as gas flow, temperature, pressure, power etc., proper referencing can be established by the Adaptive Intelligence (AI) to identify abnormalities. Sensor traces from Process of Record (POR) runs may be used as starting references.
Conclusion
The DFD solution reduces risk in manufacturing by protecting against events that impact yield. It also provides engineers with an innovative new tool that addresses several limitations of today’s traditional FDC systems. As shown in TABLE 1, the solution greatly reduces the time required for deployment and maintenance, while providing a more thorough and accurate detection of issues.
| TABLE 1 | ||
| FDC
(Per Recipe/Tool Type) |
DFD
(Per Recipe/Tool Type) |
|
| FDC model creation | 1 – 2 weeks | < 1 day |
| FDC model validation and fine tuning | 2 – 3 weeks | < 1 week |
| Model Maintenance | Ongoing | Minimal |
| Typical Alarm Rate | 100-500/chamber-day | < 50/chamber-day |
| % Coverage of Number of Sensors | 50-60% | 100% as default |
| Trace Segment Coverage | 20-40% | 100% |
| Adaptive to Systematic Behavior Changes | No | Yes |
TOM HO is President of BISTel America where he leads global product engineer and development efforts for BISTel. [email protected]. STEWART CHALMERS is President & CEO of Hill + Kincaid, a technical marketing firm. [email protected].
Editor’s Note: This article was originally published in the October 2018 issue of Solid State Technology.