
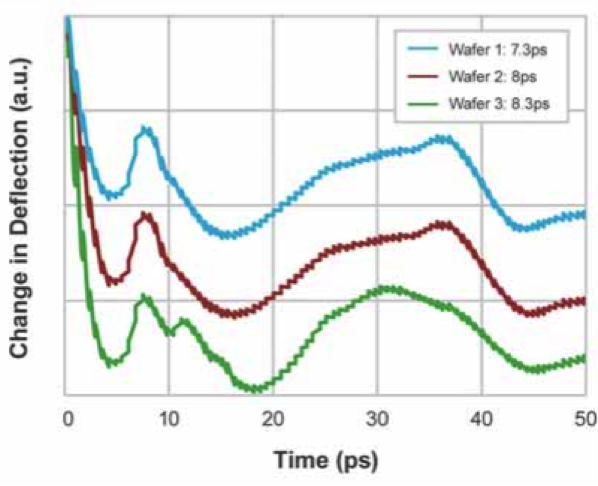
FIGURE 4. Raw data showing change in deflection versus
time. The measurements are from DOE skew wafers of varying thickness from the SRAM structure. The large zero peak is the pump laser pulse and the next peak to the left is the first returning echo. The time elapsed to the first echo is seen to increase for the three wafers, corresponding to known increases in thickness.