Category Archives: Device Architecture

DENNIS JOSEPH, Mentor, a Siemens Business, Beaverton, OR

As foundries advance their process technology, integrated circuit (IC) layout designers have the ability to deliver more functionality in the same chip area. As more content goes into a layout, the file size also increases. The results? Design companies are now dealing with full-chip Graphic Database System (GDSII/GDS™) layouts that are hundreds of gigabytes, or even terabytes, in size. Although additional storage can be purchased relatively inexpensively, storage availability is becoming an ongoing and increasingly larger concern.

And storage is not the only, or even the most important, issue. File size and layout loading time become increasingly critical concerns as process technology advances. Electronic design automation (EDA) tools can struggle to effectively manage these larger layouts, resulting in longer loading times that can frustrate users and impact aggressive tape-out schedules. Layout loading happens repeatedly throughout the design process—every time designers create or modify a layout, check timing, run simulations, run physical verification, or even just view a layout—so the effect of loading time becomes cumulative throughout the design and verification flow.

Layout designers often try to address the file size problem by zipping their GDS layouts. This approach does reduce file sizes, but it can actually increase loading times, as tools must unzip the file before they can access the data. Need a better, more permanent, solution?

Switch to the Open Artwork System Interchange Standard (OASIS®) format, which can reduce both file sizes and loading times. The OASIS format has been available for almost 15 years [1] and is accepted by every major foundry. It is also supported by all industry standard EDA tools [2].

The OASIS format has several features that help reduce file size compared to the GDS format.

  • OASIS data represents numerical values with variable byte lengths, whereas the GDS format uses fixed byte lengths.
  • OASIS functionality can also recognize complex patterns within a layout and store them as repetitions, rather than as individual instances or geometry objects.
  • The OASIS CBLOCKs feature applies Gzip compression to the individual cells within a layout. Because this compression is internal to the file, tools do not need to create a temporary uncompressed file, which is often necessary with normal Gzip compression. Additionally, although unzipping a Gzip file is typically a single-threaded process, CBLOCKs can be uncompressed in parallel.
  • Strict mode OASIS layouts contain an internal lookup table that can tell a reader the location of different cells within the file. This information allows the reader to more efficiently parallelize the loading of the layout and can offer significant loading time improvement.

Although features such as CBLOCK compression and strict mode are not required, it is highly recommended that layout designers utilize both to realize the fastest loading times in their tools while maintaining small file sizes.

What’s wrong with gds.gz?

Many layout designers have resorted to zipping their GDS layouts, which in measured testcases reduced file sizes by an average of 85%. However, beyond cell placements, designs typically contain a lot of repetition that is not recognized by the GDS format. As a result, much of a GDS file is redundant information, which is why zipping a GDS layout can achieve such significant compression ratios. The OASIS format natively recognizes this repetition and stores this information more compactly. Additionally, taking advantage of CBLOCKs reduced file sizes by an additional 80% from the zipped GDS layouts and by almost 97% from the uncompressed GDS layouts. FIGURE 1 shows the file size reduction that can be achieved by using the OASIS format instead of a zipped GDS layout.

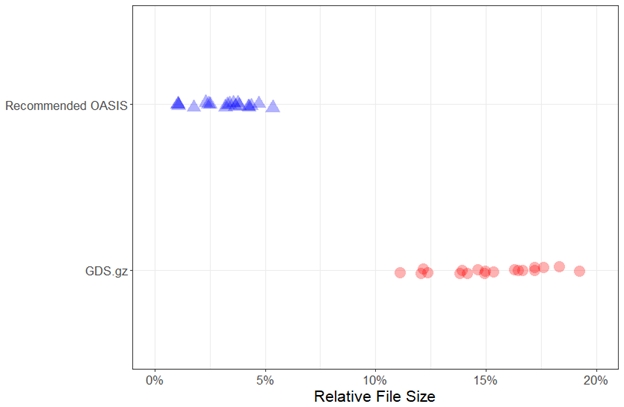
FIGURE 1. File sizes relative to the uncompressed GDS layout (smaller is better). In all measured testcases, the recommended OASIS options delivered smaller file sizes than zipping the uncompressed GDS layout.

In addition, a zipped GDS layout’s file size reductions are usually offset by longer loading times, as tools must first unzip the layout. As seen in FIGURE 2, the DRC tool took, on average, 25% longer to load the zipped GDS layout than the corresponding uncompressed GDS layout. Not only were the corresponding recommended OASIS layouts smaller, the DRC tool was able to load them faster than the uncompressed GDS layouts in all measured testcases, with improvements ranging from 65% to over 90%.

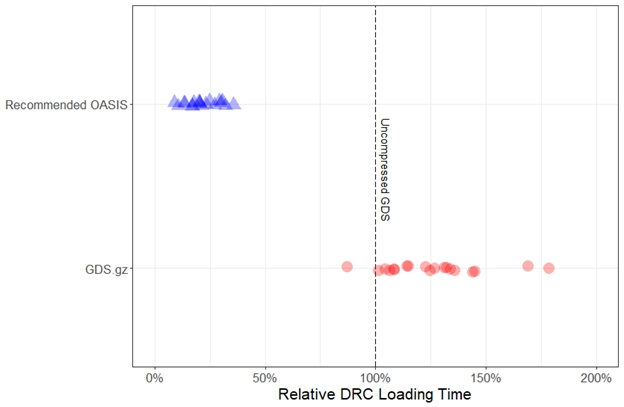
FIGURE 2. DRC loading times relative to the uncompressed GDS layout (smaller is better). In all measured testcases, the recommended OASIS options delivered faster DRC loading times than zipping the uncompressed GDS layout.

While Figs. 1 and 2 considered file sizes and loading times separately, the reality is that layout designers must deal with both together. As seen in FIGURE 3, plotting both quantities on the same chart makes it even clearer that the recommended OASIS options deliver significant benefits in terms of both file size and loading time.

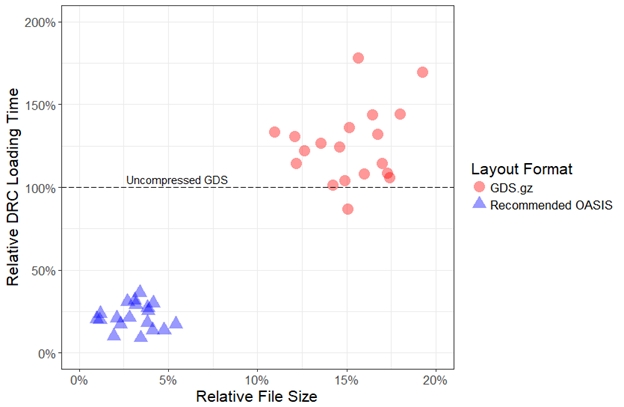
FIGURE 3. DRC loading times versus file size, both relative to the uncompressed GDS layout (smaller is better for both axes). In all measured testcases, the recommended OASIS options delivered faster DRC loading times and smaller file sizes than zipping the uncompressed GDS layout.

Loading time costs are incurred throughout the design process every time a user runs physical verification or even just views a layout. DRC tools are typically run in batch mode, where slow loading performance may not be as readily apparent. However, when viewing a layout, users must actively wait for the layout to load, which can be very frustrating. As seen in FIGURE 4, viewing a zipped GDS layout took up to 30% longer than viewing the uncompressed GDS layout. In addition to the file size reduction of almost 80% (compared to the zipped GDS layout), switching to the OASIS format with the recommended options reduced the loading time in the layout viewer by an average of over 70%.

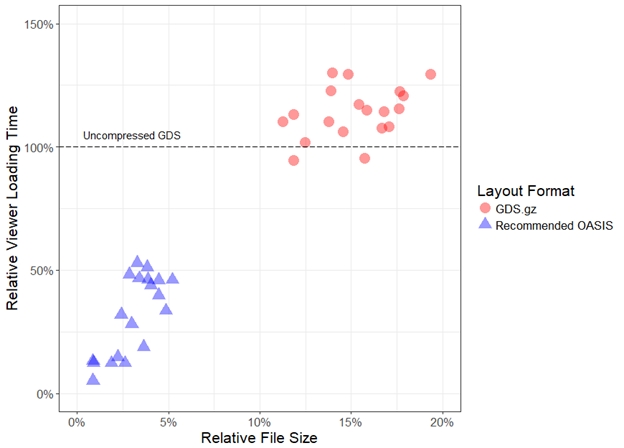
FIGURE 4. Layout viewer loading times versus file size, both relative to the uncompressed GDS layout (smaller is better for both axes). In all measured testcases, the recommended OASIS options also delivered faster loading times than zipping the uncompressed GDS layout.

What about zipping an OASIS layout?

Layout designers may think that zipping an OASIS layout can provide additional file size reductions. However, CBLOCKs and Gzip use similar compression algorithms, so using both compression methods typically provides only minimal file size reductions, while loading times actually increase because tools must uncompress the same file twice.

In a few cases, zipping an uncompressed OASIS layout may reduce file sizes more than using CBLOCKs. However, layout readers cannot load a zipped OASIS layout in parallel without first unzipping the file, which leads to increased loading times. As seen in FIGURE 5, the zipped OASIS layout had 6% smaller file sizes when compared to the recommended OASIS layout. However, DRC loading times increased by an average of over 60% to offset this benefit, and, in several cases, the loading time more than doubled.

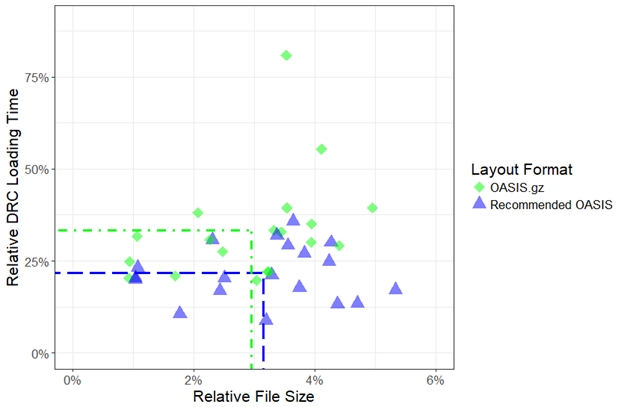
FIGURE 5. DRC loading time versus file size, both relative to the uncompressed GDS layout (smaller is better for both axes), with the means of both axes overlaid. There is a small file size reduction when zipping the uncompressed OASIS layout, but there is a significant loading time penalty.

 What should I do next?

At 16 nm and smaller nodes, block-level and full-chip layouts should be in the OASIS format, specifically with the strict mode and CBLOCKs options enabled. Moving flows to utilize these recommendations can provide dramatically smaller file sizes and faster loading times.

Maintaining data integrity is critical, so layout designers may want to first switch a previous project to the OASIS format to reduce the risk and see firsthand the benefits of switching. They can also run an XOR function to convince themselves that no data is lost by switching to the OASIS format. Additionally, every time physical verification is run on an OASIS layout, it is another check that the layout is correct.

Layout designers can convert their layouts to the OASIS format using industry-standard layout viewers and editors. For best results, designers should enable both CBLOCKs and strict mode when exporting the layout. Designers should also confirm that these features are utilized in their chip assembly flow to reduce the loading time when running full-chip physical verification using their DRC tool.

Conclusion

File size and layout loading time have become increasingly important concerns as process technology advances. While storage is relatively inexpensive, it is an unnecessary and avoidable cost. Longer layout loading times encountered throughout the design process are similarly preventable.

The OASIS format has been around for almost 15 years, is accepted by every major foundry, and is supported by all industry-standard EDA tools. Switching to the OASIS format and utilizing features such as CBLOCKs and strict mode can provide users with dramatically smaller file sizes and faster loading times, with no loss of data integrity.

DENNIS JOSEPH is a Technical Marketing Engineer supporting Calibre Interfaces in the Design-to-Silicon division of Mentor, a Siemens Business. [email protected].

Editor’s Note: This article originally appeared in the October 2018 issue of Solid State Technology. 

A lithographic method for TSV alignment to embedded targets was evaluated using in-line stepper self metrology, with TIS correction.

BY WARREN W. FLACK, Veeco Instruments, Plainview, NY and JOHN SLABBEKOORN, imec, Leuven, Belgium

Demand for consumer product related devices including backside illuminated image sensors, interposers and 3D memory is driving advanced packaging using through silicon via (TSV) [1]. The various process flows for TSV processing (via first, via middle and via last) affect the relative levels of integration required at the foundry and OSAT manufacturing locations. Via last provides distinct advantages for process integration, including minimizing the impact on back end of line (BEOL) processing, and does not require a TSV reveal for the wafer thinning process. Scaling the diameter of the TSV significantly improves the system performance and cost. Current via last diameters are approximately 30μm with advanced TSV designs at 5 μm [2].

Lithography is one of the critical factors affecting overall device performance and yield for via last TSV fabrication [2]. One of the unique lithography requirements for via last patterning is the need for back-to-front side wafer alignment. With smaller TSV diameters, the back-to- front overlay becomes a critical parameter because via landing pads on the first level metal must be large enough to include both TSV critical dimension (CD) and overlay variations, as shown in FIGURE 1. Reducing the size of via landing pads provide significant advantages for device design and final chip size. This study evaluates 5μm TSVs with overlay performance of ≤ 750nm.

Alignment, illumination and metrology

Lithography was performed using an advanced packaging 1X stepper with a 0.16 numerical aperture (NA) Wynne Dyson lens. This stepper has a dual side alignment (DSA) system which uses infrared (IR) illumination to view metal targets through a thinned silicon wafer [3]. For the purposes of this study and its results, the wafer device side is referred to as the “front side” and the silicon side is referred to as the “back side.” The side facing up on the lithography tool is the back side of the TSV wafer, as shown in FIGURE 2.

The top IR illumination method for viewing embedded alignment targets, shown in Fig. 2, provides practical advantages for integration with stepper lithography. Since the illumination and imaging are directed from the top, this method does not interfere with the design of the wafer chuck, and does not constrain alignment target positioning on the wafer. The top IR alignment method illuminates the alignment target from the back side using an IR wavelength capable of transmitting through silicon (shown as light green in FIGURE 2) and the process films (shown in blue). In this configuration the target (shown in orange) needs to be made from an IR reflective material such as metal for optimal contrast. The alignment sequence requires that the wafer move in the Z axis in order to shift alignment focus from the wafer surface to the embedded target.

Back-to-front side registration was measured using a metrology package on the lithography tool which uses the DSA alignment system. This stepper self metrology package (DSA-SSM) includes routines to diagnose and compensate for measurement error from having features at different heights. For each measurement site the optical metrology system needs to move the focus in Z between the resist feature and the embedded feature. Therefore angular differences between the Z axis of motion, the optical axis of the alignment camera, and the wafer normal will contribute to measurement error for the tool [3]. The quality of the wafer stage motion is also very important because a significant pitch and roll signature would result in a location dependent error for embedded feature measurement, which would complicate the analysis.

If the measurement operation is repeatable and consistent across the wafer, then a constant error coming from the measurement tool, commonly referred to as tool induced shift (TIS), can be characterized using the method of TIS calibration, which incorporates measurements at 0 and 180 degree orientations. The TIS error—or calibration—is calculated by dividing the sum of offsets for the two orientations by two [4]. While the TIS calibration is effective for many types of measurements for planar metrology, for embedded feature metrology, the quality of measurement and calibration also depend on the quality and repeatability of wafer positioning, including tilt. In previous studies, the registration data obtained from the current method were self consistent and proved to be an effective inspection method [3, 5]. However given the dependencies affecting TIS calibration for embedded feature metrology, it is desirable to confirm the registration result using an alternate metrology method [5]. In order to independently verify the DSA-SSM, overlay data dedicated electrical structures were designed and placed on the test chip.

Electrical verification of TSV alignment is performed after complete processing of the test chip and relies on the landing position of a TSV on a fork-to-fork test structure in the embedded metal 1 (damascene metal). When the TSV processing is complete the copper filled TSV will make contact with metal 1. The TSV creates a short between the two sets of metal forks, allowing measurement of two resistance values which can be translated into edge measurements. For the case of ideal TSV alignment, the two resistances are equal. The measurement resolution of the electrical structure is limited by the pitch of the fork branches. In this study resolution is enhanced by creating structures with four different fork pitches. A similar fork-to-fork structure rotated 90 degrees is used for the Y alignment. Using this approach both overlay error and size of the TSV in both X and Y can be electrically determined [6].

Experimental methods

This study scrutinizes image placement performance by examining DSA optical metrology repeatability after TSV lithography, and then comparing this optical registration data with final electrical registration data.

The TSV-last process begins with a 300mm device wafer with metal 1, temporarily bonded to a carrier for mechanical support as shown in FIGURE 3. The back side of the silicon device wafer (light green) is thinned by grinding and then polished smooth by chemical mechanical planarization (CMP). The TSV is imaged in photoresist (red) and etched through the thinned silicon layer. FIGURE 3 depicts the complete process flow including the TSV, STI and PMD etch, TSV fill, redis- tribution layer (RDL) and de-bonding from carrier. The aligned TSV structure must land completely on the metal 1 pad (dark blue).

TSV lithography is done with a stepper equipped with DSA. The photoresist is a gh-line novolac based positive- tone material requiring 1250mJ/cm2 exposure dose with a thickness of 7.5μm [5]. The TSV diameter is 5μm, and the silicon thickness is 50μm. TSV etching of the silicon is performed by Bosch etching [7]. Tight control of lithography and TSV etching is required to insure that vias land completely on metal 1 pads, as shown in FIGURE 1.

Acceptable features for DSA-SSM metrology need to fit the via process requirements for integration. Since the TSV etch process is very sensitive to pattern size and density, the TSV layer is restricted to one size of via, and the DSA-SSM measurement structure is constructed using this shape. The design of the DSA-SSM measurement structure uses a cluster of 5μm vias with unique grouping and clocked rotation to avoid confusion with adjacent TSV device patterns during alignment.

FIGURE 4 shows two different focus offsets of DSA camera images of the overlay structure. For this structure, the reference metal 1 feature (outlined by the blue ring) and the resist pattern feature (outlined by the red ring) are not in the same focal plane. For a silicon thickness of 50μm, focusing on one feature will render the other feature out of focus, requiring each feature to have its own focus offset, which is specified in the metrology measurement recipe.

Optical registration process control

This study leveraged a sampling plan of 23 lithography fields with 5 measurements per field, resulting in a total of 115 measurements per wafer. Since the full wafer layout contains 262 fields, this sampling plan provides a good statistical sample for monitoring linear grid and intrafield parameters.

In the initial run, the overlay settings were optimized using the DSA-SSM metrology feedback and then the parameters were fixed to investigate overlay stability over a nine-week period. Trend charts for mean and 3σ for seven TSV lots are shown in FIGURE 5. Each measurement lot consists of 8 wafers, with 115 measure- ments per wafer, and all data is corrected for TIS on a per lot basis using measurements of a single wafer at 0 and 180 degree orientations [3]. The lot 3σ is consistently less than 600nm over the nine-week period. There appears to be a consistent small Y mean error (blue diamond) that could be adjusted to improve subsequent overlay results. With a Y mean correction applied, the registration data shows mean plus 3σ ≤ 600nm.

Validating TSV alignment and in-line optical metrology

Two TSV last test chip wafers were completely processed to the stage that they can be electrically measured. TABLE 1 shows the registration numbers confirming a good match between the two metrology methods. It is important to note that an extra translation step is performed between the optical and the electrical measurement: the TSV etch.

In this analysis the TSV etch is assumed to be perfectly vertical. From the data we can conclude that the TSV etch is indeed vertical enough not to interfere with the overlay data. Otherwise this would show as translation or scaling effects between the two metrology methods.

Conclusions

The lithographic method for TSV alignment to embedded targets was evaluated using in-line stepper self metrology, with TIS correction. Registration data was collected over a nine-week period to characterize the stability of TSV alignment. With corrections applied, the registration data demonstrates mean plus 3σ ≤ 600nm. The in-line optical registration data was then correlated to detailed electrical measurements performed on the same wafers at the end of the process to provide independent assessment of the accuracy of the optical data. Good correlation between optical and electrical data confirms the accuracy of the in-line optical metrology method, and also confirms that the TSV etch through 50μm thick silicon is vertical.

References

1. Vardaman, J. et. al., TechSearch International: Advanced Packaging Update, July 2016.
2. Van Huylenbroeck, S. et. al., “Small Pitch High Aspect Ratio Via Last TSV Module”, The 66th Electronic Components and Technology Conference, Los Vegas, NV, May 2016.
3. Flack, W. et. al., “Optimization of Through Si Via Last Lithography for 3D Packaging”, Twelfth International Wafer- Level Packaging Conference, San Jose, CA, October 2015.
4. Preil, M. et. al, “Improving the Accuracy of Overlay Measurements through Reduction of Tool and Wafer Induced Shifts”, Metrology, Inspection, and Process Control for Microlithography Proceedings, SPIE 3050, 1997.
5. Flack, W. et. al., “Verification of Back-to-Front Side Alignment for Advanced Packaging”, Ninth Interna- tional Wafer-Level Packaging Conference, Santa Clara, CA, November. 2012.
6. Flack, W. et.al., “Overlay Performance of Through Si Via Last Lithography for 3D Packaging”, 18th Electronics Packaging Technology Conference, Singapore, December 2016
7. Slabbekoorn, J. et. al, “Bosch Process Characterization For Donut TSV’s” Eleventh International Wafer-Level Packaging Conference, Santa Clara, CA, November 2014.

Layout schema generation generates random, realistic, DRC-clean layout patterns of the new design technology for use in test vehicles.

BY WAEL ELMANHAWY and JOE KWAN, Mentor Graphics, Beaverton, OR

Predicting and improving yield in the early stages of technology development is one of the main reasons we create test macros on test masks. Identifying potential manufacturing failures during the early technology development phase lets design teams implement upstream corrective actions and/or process changes that reduce the time it takes to achieve the desired manufacturing yield in production. However, while conventional yield ramp techniques for a new technology node rely on using designs from previous technology nodes as a starting point to identify patterns for design of experiment (DoE) creation, what do you do in the case of a new design technology, such as multi- patterning, that did not exist in previous nodes? The human designer’s experience isn’t applicable, since there isn’t any knowledge about similar issues from previous designs. Neither is there any prior test data from which designers can draw feedback to create new test structures, or identify process or design style optimizations that can improve yield more quickly.

An innovative new technology, layout schema gener- ation (LSG), enables design teams to generate additional macros to add to test structures without relying on past designs for input. These macros are based on the gener- ation and random placement of unit patterns that can construct more meaningful larger patterns. Specifications governing the relationships between those unit patterns can be adjusted to generate layout clips that look like realistic designs. Those layout clips can then be used in design of experiment (DoE) trials to predict yield, and identify potential design and process optimizations that will help improve yield. By using this new LSG process, designers can significantly reduce the time it takes to achieve the desired yield for designs that include new design techniques.

Issues affecting yield

Wafer yield is typically reduced by three categories of defects. The first category comprises random defects, which occur due to the existence of contamination particles in the different process chambers. A conducting particle can short out two or more neighboring wires, or create a leakage path. A non-conducting particle or a void can open up a wire or a via, or create high resistive paths. FIGURE 1 shows scanning electron microscope (SEM) images of these two types of random defects.

The second category contains systematic defects, which occur due to an imperfect physical layout architecture, or the impact of non-optimized optical process recipes and/ or equipment. Systematic defects are typically the biggest source of yield detraction [1], but a majority of them can be eliminated through design-technology co-optimization (DTCO), in which the design and process sides commu- nicate more freely to achieve faster rates of improvement.

The third category, which we’re not addressing in this article, includes parametric defects (such as a lack of uniformity in the doping process) that may affect the reliability of devices.

Layout schema generation

To demonstrate the use and applicability of the LSG process, let’s look at designs that use the self-aligned multi-patterning (SAMP) process. Multi-patterning (MP) technology with ArF 193i lithography is currently the preferred choice over extreme ultraviolet (EUV) lithography for advanced technology nodes from 20nm on down. At 7 nm and 5 nm nodes, the SAMP process appears to be one of the most effective MP techniques in terms of achieving a small pitch of printed lines on the wafer, but its yield is in question. Of course, before being deployed in production, it must be thoroughly tested on test vehicles. However, without any previous SAMP designs, design of an appropriate test vehicle is challenging. In addition to the lack of historical test data, the unidirectional nature of the SAMP design complicates the design of the conven- tional serpentine and comb test shapes, which contain bidirectional components.

Self-aligned multi-patterning process

In the SAMP process [3], the first mask is known as the mandrel mask. Sacrificial mandrel shapes are printed with a relaxed pitch, and then used to develop sidewalls. The sidewalls are at half the mandrel’s pitch. Depending on the tone, target shapes may exist in the spaces between the sidewalls. The target shapes can be reused as sacrificial mandrel shapes to form another generation of sidewalls. Wafer shapes that don’t have corresponding mask shapes are called non-mandrel shapes. This process can be repeated to achieve SAMP layouts with a reduced pitch. The SAMP process (FIGURE 2) restricts the designs to be almost unidirectional. Generated parallel lines will be cut later by a cut mask at the desired line ends to form the correct connectivity.

Test vehicles

A test vehicle is typically a subset of the masks for a design, designed specifically to induce potential systematic failures or lithographic hotspots on the layer under test. It may also contain some test structures specially designed for the detection of random defects. The main compo- nents in a test vehicle for any new node are serpentine and comb shapes (to capture random defects), and preliminary standard cell designs (with many variations, to assess their quality). Other structures are typically added based on experience derived from production chips of previous nodes.

In a new node, all test structures on the test vehicle are vital for process training and characterization. Feedback from the test process is used for design style optimization. For example, when “bad” layout geometries are discovered after manufacturing, they can be captured as patterns, assigned low scores, and stored in a design for manufacturing (DFM) pattern library [2]. The designer can then use DFM analysis to find the worst patterns in a given layout, and modify or eliminate them. Such early DTCO provides a faster yield ramp for new nodes. Even in mature nodes, test structures are used on production wafers to identify additional opportunities for process refinement and optimization, which will have a positive impact on future yield.

One of the obstacles in test vehicle design is that it depends mainly on human designer’s experience and memory. Although experienced designers have seen multiple design styles in older nodes, the design shapes they are familiar with are limited to those styles. It typically takes a long time to design new test structures that cover new shapes, especially for a new process. The LSG solution adds more macros (generated in a random fashion) to the standard test structures strategy to speed up new shape yield analysis.

Random test pattern generation

The key component of the LSG solution is a method for the random generation of realistic design-like layouts, without design rule violations. The LSG process uses a Monte Carlo method to apply randomness in the generation of layout clips by inserting basic unit patterns in a grid. These unit patterns represent simple rectangular and square polygons, as well as a unit pattern for inserting spaces in the design. Unit pattern sizes depend on the technology pitch value. During the generation of the layouts, known design rules are applied as constraints for unit pattern insertion. Once the rules are configured, an arbitrary size of layout clips can be generated (FIGURE 3).

To begin, the SAMP design rules are converted to a format readable by an automated LSG tool like the Calibre® LSG tool from Mentor, a Siemens Business. Once the rules are configured, the Calibre LSG process can automatically generate an arbitrarily wide area of realistic DRC-clean SAMP patterns. The area is only limited by the floorplan of the designated macro of SAMP test structures. Test patterns can be also generated with power rails to mimic the layouts of standard cells. FIGURE 4 shows a sample clip of the generated output layout. To be ready for the experiments, the SAMP design is decomposed into the appropriate mandrel and cut masks, according to the decomposition rules. This operation also distinguishes between mandrel and non-mandrel shapes.

Design of Experiment

In the design phase of the test vehicle, the generated SAMP patterns are added to the typical contents of regular test patterns. The random SAMP patterns are electrically meaningless, unless they are connected to other layers to set up the required experiment. The DoE determines the way the connections are made from the patterns up to the testing pads, to detect different fail modes. Fail modes include short circuits due to lithographic bridging or conducting particles, and open circuits due to lithographic pinching, non-conducting particles, voids, or open vias.

A via chain can be constructed to connect the random DoE of SAMP structures through a routing layer to external pads for electrical measurement. These clips are decomposed according to the decomposition rules of the technology into the appropriate mandrel and cut masks. The decomposed clips can be tested through simulations, or electrically on silicon to discover hotspots. The discovered hotspots can be analyzed to determine root cause, which can be used to modify design layouts and/or optimize the fabrication process and models to eliminate these hotspots in future production. They can also be used as learning patterns for DFM rule deck devel- opment. By expanding the size of the randomly generated test structures, more hotspots can be detected, which can provide an even faster way to enhance the yield of a new technology node.

To demonstrate the effectiveness of the LSG process, we performed two experiments on a set of SAMP patterns similar to those shown in FIGURE 4.

Detecting random conducting particles

The first experiment collected data about random defects caused by conducting particles. In this experiment, all mandrel shapes are connected through the upper (or lower) via and metal layers, up to a testing pad. All non-mandrel shapes are connected in the same way to another testing pad. The upper routing layer forms two interdigitated comb shapes. FIGURE 5 shows a layout snippet of the connections. All via placements and upper metal routings were made with a custom script, without the intervention of a human designer. Ideally the two testing pads should be disconnected, as no mandrel shape can touch a non-mandrel shape. If the testing probes are found to be connected, this likely indicates a random conducting particle defect, or a lithographic bridge. The localization and analysis of such defects [4] can help with yield estimation and enhancement.

Detecting systematic cut mask resolution problems

One example of a systematic lithographic defect found in SAMP designs is when the cut mask is not resolved correctly. This causes two shapes on the same track to be shorted out through the unresolved cut shape. The testing of such a case requires connecting every other polygon on the same track. This was done with a generating script, without the intervention of human designers. FIGURE 6 shows a snippet of the generated layout with the connections. If the test probes are found to be connected while the two pads (ideally) are disconnected, this may indicate an unresolved cut shape. The analysis of the defect location and data from multiple wafers can prove the root cause of the defect.

Results

The two experiments described above were placed on a test vehicle of an advanced node. The test macro containing the first experiment setup successfully detected several conducting particle defects. A sample SEM image of the discovered defect is shown in FIGURE 7. Statistical data from multiple wafers were used to model the defect density and estimate the yield target.

Repetitive fail data from the test macro of the second experiment indicated systematic failures at particular locations. The analysis showed that the root cause of the failure was a poorly resolving cut shape in some process corners, as was predicted in the DoE. FIGURE 8 shows a snippet of the generated layout and its contour simulation.

To test the effectiveness of the random approach in capturing defects, 20 SAMP design clips were generated with linearly increasing sizes, such that the 20th clip was 20X bigger than the first clip. Lithography simulations were executed on the cut mask to inspect potential failures. The contours were checked, and potential failures were identified and categorized. FIGURE 9 shows the number of the unique hotspots found in each clip. The graph shows that the number of identified hotspots tends to saturate with the chip size. The second clip has 2X the number of unique hotspots found in the first clip, while the 20th clip only sees around a 6X increase. This result is expected, as many hotspots in the larger clips are just replicas of those found in the small clips. Assuming that the LSG tool is configured correctly, this result means most of the potential hotspots can be covered in a reasonable size test vehicle.

Conclusion

Test vehicles are vital for yield ramp up in new technologies and yield enhancement in mature nodes, but it can be difficult to design accurate test structures for new design styles and technologies that have no relevant history. Innovative techniques are needed to achieve comprehensive coverage of potential manufacturing failures created by new design styles, while ensuring full compliance with known design rule checks. A new solution using layout schema generation generates random, realistic, DRC-clean layout patterns of the new design technology for use in test vehicles. Experiments with this technology show it can provide high coverage of new design styles for an arbitrarily-wide design area. Circuitry can be added to the generated clips to make them electrically measurable for the detection of potential failures. The ability to discover lithographic hotspots and systematic failures early in the technology development process is significantly improved, at the expense of additional testing area. This design/technology co-optimization speeds up the yield optimization for new technology nodes, improving a critical success factor for market success.

References

1. Lee, J.H., Lee, J.W., Lee, N.I., Shen, X., Matsuhashi, H., Nehrer, W., “Proactive BEOL yield improvement methodology for a successful mobile product,” Proc. IEEE ISCDG, 93-95 (2012).
2. Park, J., Kim, N., Kang, J.-H., Paek, S.W., Kwon, S., Shafee, M., Madkour, K., Elmanhawy, W., Kwan, J., et al., “High coverage of litho hotspot detection by weak pattern scoring,” Proc. SPIE 9427, 942703 (2015)
3. Bencher, C., Chen, Y., Dai, H., Montgomery, W., Huli, L., “22nm half-pitch patterning by CVD spacer self alignment double patterning (SADP),” Proc. SPIE 6924, 69244E (2008)
4. Schmidt, M., Kang, H., Dworkin, L., Harris, K., Lee, S., “New methodology for ultra-fast detection and reduction of non-visual defects at the 90nm node and below using comprehensive e-test structure infrastructure and in-line DualBeamTM FIB,” IEEE/ SEMI ASMC, 12-16 (2006).

Researchers at Tokyo Institute of Technology (Tokyo Tech) report a unipolar n-type transistor with a world-leading electron mobility performance of up to 7.16 cm2 V-1 s-1. This achievement heralds an exciting future for organic electronics, including the development of innovative flexible displays and wearable technologies.

Researchers worldwide are on the hunt for novel materials that can improve the performance of basic components required to develop organic electronics.

Now, a research team at Tokyo Tech’s Department of Materials Science and Engineering including Tsuyoshi Michinobu and Yang Wang report a way of increasing the electron mobility of semiconducting polymers, which have previously proven difficult to optimize. Their high-performance material achieves an electron mobility of 7.16 cm2 V-1 s-1, representing more than a 40 percent increase over previous comparable results.

In their study published in the Journal of the American Chemical Society, they focused on enhancing the performance of materials known as n-type semiconducting polymers. These n-type (negative) materials are electron dominant, in contrast to p-type (positive) materials that are hole dominant. “As negatively-charged radicals are intrinsically unstable compared to those that are positively charged, producing stable n-type semiconducting polymers has been a major challenge in organic electronics,” Michinobu explains.

The research therefore addresses both a fundamental challenge and a practical need. Wang notes that many organic solar cells, for example, are made from p-type semiconducting polymers and n-type fullerene derivatives. The drawback is that the latter are costly, difficult to synthesize and incompatible with flexible devices. “To overcome these disadvantages,” he says, “high-performance n-type semiconducting polymers are highly desired to advance research on all-polymer solar cells.”

The team’s method involved using a series of new poly(benzothiadiazole-naphthalenediimide) derivatives and fine-tuning the material’s backbone conformation. This was made possible by the introduction of vinylene bridges[1] capable of forming hydrogen bonds with neighboring fluorine and oxygen atoms. Introducing these vinylene bridges required a technical feat so as to optimize the reaction conditions.

Overall, the resultant material had an improved molecular packaging order and greater strength, which contributed to the increased electron mobility.

Using techniques such as grazing-incidence wide-angle X-ray scattering (GIWAXS), the researchers confirmed that they achieved an extremely short π-π stacking distance[2] of only 3.40 angstrom. “This value is among the shortest for high mobility organic semiconducting polymers,” says Michinobu.

There are several remaining challenges. “We need to further optimize the backbone structure,” he continues. “At the same time, side chain groups also play a significant role in determining the crystallinity and packing orientation of semiconducting polymers. We still have room for improvement.”

Wang points out that the lowest unoccupied molecular orbital (LUMO) levels were located at -3.8 to -3.9 eV for the reported polymers. “As deeper LUMO levels lead to faster and more stable electron transport, further designs that introduce sp2-N, fluorine and chlorine atoms, for example, could help achieve even deeper LUMO levels,” he says.

In future, the researchers will also aim to improve the air stability of n-channel transistors — a crucial issue for realizing practical applications that would include complementary metal-oxide-semiconductor (CMOS)-like logic circuits, all-polymer solar cells, organic photodetectors and organic thermoelectrics.

The IC industry has been on a mission to pare down older capacity (i.e., ≤200mm wafers) in order to produce devices more cost-effectively on larger wafers.  In its recently released Global Wafer Capacity 2019-2023 report, IC Insights shows that due to the surge of merger and acquisition activity in the middle of this decade and with more companies producing IC devices on sub-20nm process technology, suppliers are eliminating inefficient wafer fabs. Over the past ten years (2009-2018), semiconductor manufacturers around the world have closed or repurposed 97 wafer fabs, according to findings in the new report.

Figure 1 shows that since 2009, 42 150mm wafer fabs and 24 200mm wafer fabs have been shuttered. 300mm wafer fabs have accounted for only 10% of total fab closures since 2009.  Qimonda was the first company to close a 300mm wafer fab after it went out of business in early 2009.

Figure 1

Three 150mm wafer fabs were closed or repurposed in 2018.  Two of these fabs belonged to Renesas.  Renesas closed one fab in Konan, Kochi, Japan that produced analog, logic, and some older microcomponent devices.  A second Renesas fab in Otsu, Shiga, Japan was repurposed and now makes only optoelectronic devices.  A third fab, Fab 1 belonging to Polar Semiconductor (now Sanken) in Bloomington, Minnesota, also was closed.  This fab manufactured analog, discretes, and offered some foundry services.

Given the skyrocketing cost of new wafer fabs and manufacturing equipment, and as more IC companies transition to a fab-lite or fabless business model, IC Insights anticipates there will be additional fab closures in the next few years.  Five closures/repurposed fabs have already been publicly announced. Samsung’s 300mm memory fab (Line 13) will be fully converted this year to produce image sensors and TI’s 200mm analog GFAB in Greenock, Scotland, is expected to close by June 2019.  Renesas plans to close two 150mm fabs (Otsu, Shiga and Ube, Yamaguchi, Japan) in 2020 or 2021, and Analog Devices plans to close its 150mm wafer fab in Milpitas, California in February 2021.

Semiconductor suppliers in Japan have closed a total of 36 wafer fabs since 2009, more than any other country/region.   In the same period, 31 fabs were closed in North America, 18 fabs were shuttered in Europe, and 12 wafer fabs were closed throughout the Asia-Pacific region (Figure 2).  With 36 fab closures and very few new fabs going up there, it is little wonder that Japan now accounts for only 5% of worldwide semiconductor capital spending.

Figure 2

ON Semiconductor (Nasdaq: ON) today announced its top distribution partners for 2018. These awards honor the distributor in each region that led overall channel sales, grew market share, captured increased sales of products and scored highly on overall process excellence in an evolving semiconductor market.

The top 2018 distribution partners are:

  • Americas: Future Electronics
  • APAC: WPI
  • EMEA: Avnet/Silica
  • Japan: OS Electronics
  • Global High Service Distributor: Mouser Electronics
  • Global Distributor: Avnet

ON Semiconductor is an industry leader in leveraging partnerships in the global distribution channel. Approximately 60 percent of the company’s business results from distribution sales, and distribution remains the fastest channel to market. Over the past few years, ON Semiconductor has grown distribution sales, which has attributed to over half of the company’s revenue dating back to 2015.

“Distribution sales accounted for approximately 60 percent of ON Semiconductor’s 2018 annual revenues,” said Jeff Thomson, vice president of global channel sales for ON Semiconductor. “The support of our worldwide distribution partners is fundamental to the success of our company’s ongoing plans to increase market penetration and continue revenue growth at a faster pace than the industry. The collaborative relationships and progressive sales programs we foster with our channel partners are an integral part of comprehensive solution selling. As advocates of these goals, each of the 2018 distribution partner award winners successfully grew product sales, generated significant new business, and effectively supported both our customers’ needs and our company initiatives for operational excellence. We thank our outstanding channel partners for their valuable contributions throughout 2018 and look forward to continued success in the coming year.”

In the third quarter of 2018, ON Semiconductor announced a monumental milestone in the company’s history by reaching over $1 billion in distribution resales. ON Semiconductor distribution partners, and this year’s honorees, have been instrumental to this tremendous milestone. In addition to this accomplishment, ON Semiconductor was recognized in 2018 as a Fortune 500 company, was named as one of Fortune’s 100 Fastest Growing Companies, was listed on the Dow Jones Sustainability Index and received recognition from Ethisphere for the fourth year in a row as one of the World’s Most Ethical Companies.

The IBM (NYSE:IBM) board of directors today elected Admiral Michelle J. Howard to the board, effective March 1, 2019.

Admiral Howard, 58, is a former United States Navy officer and the first woman to become a four-star admiral. She was the first African-American woman to command a ship in the United States Navy (the USS Rushmore). Admiral Howard was also the first African-American and the first woman to be named Vice Chief of Naval Operations when she was appointed to that role by the President in July 2014. She retired in December 2017 as the commander of United States Naval Forces in Europe and Africa and the Allied Joint Forces Command in Naples, Italy, after a distinguished 35-year career.

Admiral Howard is currently the J.B. and Maurice C. Shapiro Visiting Professor of International Affairs at George Washington University, where she teaches in the areas of cybersecurity and international policy.

Ginni Rometty, IBM chairman, president and chief executive officer, said: “Admiral Howard is a groundbreaking leader with a distinguished career in military service. Her leadership skills, international perspective and extensive experience with cybersecurity and information technology will make her a great addition to the IBM board.”

Admiral Howard graduated from the United States Naval Academy in 1982 and from the United States Army’s Command and General Staff College in 1998 with a master’s degree in military arts and sciences. She was the first female graduate of the Naval Academy to be promoted to flag officer.

She has received honorary degrees from Rensselaer Polytechnic Institute, American Public University and North Carolina State University, and is the recipient of many honors, including the NAACP Chairman’s Image Award, the French Legion of Honor and the KPMG Inspire Greatness Award.

Qualcomm Incorporated and Samsung Electronics have named two executives to join the Silicon Integration Initiative board of directors. Si2 is a global research and development joint venture that provides standard interoperability solutions for integrated circuit design tools.

Udi Landen is Vice President of Engineering at Qualcomm Technologies, Inc. In his current role, Landen provides technical, management and business leadership for engineering teams at various international sites that focus on mobile and computing design enablement and CAD methodology automation roadmaps. Prior to joining Qualcomm in 2013, Landen held executive and leadership roles at Altera Corp., Mercury Interactive and Cadence Design Systems. He is a graduate of the Technion, Israel Institute of Technology.

Seungbum Ko is Vice President of the Samsung Electronics Design Technology Team. He is responsible for all memory design methodology activities for the Samsung memory division, and also manages the relationships between memory division and EDA vendors. A 21-year veteran at Samsung, Ko’s expertise includes development of SDRAM, DDR, DDR2, DDR3, LPDD2, LPDDR3 and LPDDR4 devices. His internal honors include the Proud Samsung Award, the Jang Young-sil Award, and the Memory Award.

Landen and Ko were approved by a vote of the Si2 board, which represents leading semiconductor manufacturers and foundries, fabless companies, and EDA software providers.

Qualcomm and Samsung are active members of the Si2 OpenAccess and Compact Model Coalitions. OpenAccess is a standard application programming interface and reference source code for the design database used by all major chip design software suppliers. It provides end-user chip designers with inter-tool interoperability. Si2 standard, compact SPICE simulation models selected and supported by the Compact Model Coalition are used by every major circuit simulator in the semiconductor industry.

Micron Technology, Inc. (Nasdaq: MU) today added a new cost-efficient solid-state drive (SSD) to its client computing portfolio. The Micron 1300 SSD makes flash storage accessible to more users, enabling its adoption in a broader set of personal computing devices for a better mobile computing experience. Consumers who are eager to move from rotating media to solid state drives value fast performance, quick startup, and reliability — whether for desktop, mobile or workstation PCs. SSDs address these needs better than power-hungry hard disk drives (HDDs), yet their higher prices have kept users from shifting to SSDs. Micron redesigned the 1300 SSD series to close the price gap.

“The deployment of advanced 3D NAND technologies has led the client SSD market to branch into value and higher-performance storage segments,” said Gregory Wong, president of Forward Insights. “Micron’s latest client SSD solutions provide a coherent migration path from HDD to value-oriented SSDs.”

The new Micron 1300 SATA SSD is one of the industry’s first 96-layer triple-level cell (TLC) 3D NAND-based SSDs, available in capacities up to 1TB (in M.2) and 2TB (in 2.5-inch). This product introduction extends Micron’s leadership in high-density SSD design and high-volume manufacturing of performance 3D NAND-based flash drives. The ability to build drives with very small footprints like the M.2 SSD form factor, which is as small as a stick of gum, also hinges on Micron’s leadership in 3D NAND technology.

“We are driving innovation to deliver on the personal computing needs of users who want thinner, lighter and less power-hungry devices,” said Roger Peene, vice president of product planning and strategy for Micron’s Storage Business Unit. “Expanding our broad SSD portfolio with high-density 96-layer NAND storage delivers greater performance, form factors and efficiency at lower cost to meet the demanding needs of today’s mobile workers.”

The Micron 1300 SSD enhances storage performance for mobile, desktop and workstation PCs with 2.7x higher read throughput over HDDs.* It delivers sequential reads/writes up to 530MB/520MB per second and random reads/writes up to 90,000/87,000 input/output operations per second (IOPS).

In addition, the Micron 1300 SSD, designed to be power efficient, extends battery life between charges for the mobile worker. It uses 75 milliwatts (mW) of power, which is only 45 percent of the active (read/write) power of an average HDD.** The Micron 1300 SSD also supports Microsoft® Windows® 10 Modern Standby requirements including adaptive thermal management and near-instant transmission to low-power mode for increased productivity. The SSD also offers important features to protect valuable data such as asynchronous power-loss protection for data at rest and optional Opal 2.0 self-encryption.

The Micron 1300 SSD is an extension of the popular Micron 1100 SATA client SSD. Continuing the widely adopted SATA connectivity, Micron’s 1300 SSD series offers compelling price-to-value ratios at a range of capacities.

By Serena Brischetto

The SEMI Europe Industry Strategy Symposium (ISS Europe) returns in Milan, Italy, this year from 31st March to 2nd April, 2019 to explore new opportunities and challenges in the digital economy. Serena Brischetto of SEMI spoke with GreenWaves Technologies CEO and co-founder Loïc Lietar about the semiconductor start-up and its Internet of Things (IoT) ultra-low-power processing technology ahead of the summit.

SEMI: 
What are the mission and vision of GreenWaves Technologies?

Lietar: GreenWaves Technologies is a fabless semiconductor start-up that is designing disruptive ultra-low power embedded solutions for image, sound and vibration artificial intelligence (AI) processing in sensing devices. It was founded in late 2014 with the mission to enable the market for intelligent in-device sensors using ultra-low energy and cost-efficient computing solutions. As a result, the GreenWaves GAP8 is the industry’s first ultra-low-power processor to enable battery-operated AI in Internet of Things (IoT) applications.

SEMI: How did you move from the semiconductor industry to the start-up ecosystem?

Lietar: I worked 25 years for STMicroelectronics then four years ago left because a project didn’t materialize. At the same time, I became involved a bit by chance in the founding of GreenWaves, which turned out to be an amazing journey that I rapidly got entirely – and deadly – committed to.

SEMI: Semiconductors are usually not associated with the idea of start-up. What is the key to the success of GreenWaves and its positioning?

Lietar: Start-ups have played a significant role in the formation of our industry and in bringing innovations and disruptions to the market. But as it became more complicated to finance start-ups because of exploding development costs, the number of semiconductor start-ups shrank significantly in the past 10 years.

At GreenWaves we develop and sell IoT application processors – processors tuned for a given class of applications. In our case, we focused on machine learning inference processors and more generally signal processing and IoT for ultra-low power. We typically process and analyze images, sounds and vibrations and our technology is more than one order of magnitude more energy efficient than existing processors. For example, our processor, coupled with an infra-red sensor, can count the number of people present in a room once a minute for more than five years on a single charge.

Our architecture uses RISC-V cores. This free and open Instruction Set Architecture is seeing huge momentum and a rapidly growing community. Second, we leverage an open source project called PULP developed by the Italian Università di Bologna and the Federal Polytechnical School ETH in Zurich. While open source is a well-established model for software, this is pretty unchartered territory in the semiconductor industry. It is working very well for us, as we benefit from robust technology we can incrementally innovate on. This is why we have been able to develop our first product with 4 million Euro.

Competition is now emerging, and this is a good sign: We are not alone in believing in this market but we remain very differentiated!

SEMI: One of the reasons why semiconductor start-ups were no longer attractive to VCs is the amount of capital that start-ups need to invest. Did public funding help you too?

Lietar: Yes, public funding played a crucial role at the beginning. We received rather classically 300K Euro of French grants and then we were lucky enough to win a very selective H2020 grant, the SME instrument, for 1.2M€. In France there is a very powerful scheme of research tax credit that covers more than 30 percent of our R&D costs and French banks know how to lend money to start-ups, with a state warranty.

Source: SEMI Blog