Category Archives: Materials and Equipment

February 3, 2010 – Researchers at the U. of Michigan have developed a new biosensor that uses carbon nanotubes (CNT) and paper to quickly and inexpensively detect algae in drinking water.

Their research, published in Nano Letters, centers on microcystin-LR (MC-LR), a chemical compound produced by blue-green algae cyanobacteria, found in nutrient-rich waters and a leading biological water pollutant, and suspected of causing liver damage and possibly liver cancer. Safe drinking water is a crucial issue in both developing and developed countries — water treatment plans can neither completely remove or even test often enough for a toxin like MC-LR, according to Nicholas Kotov, project leader and U. Michigan professor in of chemical engineering, biomedical engineering and materials science and engineering.

So the team set to develop a simple, inexpensive technology to detect multiple toxins. Their work mixed carbon nanotubes with antibodies for MC-LR and impregnated them in a strip of paper. When the paper comes into contact with water contaminated with MC-LR, the antibodies spread apart the CNTs in order to reach and bond with the MC-LR, and that spreading changes the CNTs‘ electrical conductivity, which is measured by an external monitor.

From the Nano Letters paper abstract:

An antibody to the microcystin-LR (MC-LR), one of the common culprits in mass poisonings, was dispersed together with SWNTs. This dispersion was used to dip-coat the paper rendering it conductive. The change in conductivity of the paper was used to sense the MC-LR in the water rapidly and accurately. The method has the linear detection range up to 10 nmol/L and nonlinear detection up to 40 nmol/L. The limit of detection was found to be 0.6 nmol/L (0.6 ng/mL), which satisfies the strictest World Health Organization standard for MC-LR content in drinking water (1 ng/mL) and is comparable to the detection limit of the traditional ELISA method of MC-LR detection, while drastically reducing the time of analysis by more than an order of magnitude.


The device generates results in about 12 minutes, and it’s about the size of a home pregnancy test, so it’s easily portable. And by simply swapping in different antibodies, it can be adapted to detect other harmful chemicals or toxins in water or food, the researchers say.

The research was done in collaboration with China’s Wuxi University, funded by the National Science Foundation, the Air Force Office of Scientific Research, and the National Institutes of Health, as well as the National Science Foundation of China and the 11th Five Years Key Programs for Science and Technology Development of China. U. of Michigan is pursuing patent protection for the IP and is seeking partners to help commercialize the technology.


SEM images of (a) the face and (b) the edge of the 13 deposition 10 cycles paper electrode. (Source: Nano Letters)

(January 26, 2010) ATLANTA, GA — Wire bond inspection system maker Viscom introduced software tools for its very high resolution (VHR) camera module, which has the ability to provide exact measurements of balls and wedges. With this technology, 25-µm gold thin-wire wedge sizes can be measured with a standard deviation of 1 µm. In addition to inspecting qualitative characteristics of wire bonds, balls and wedges statistical evaluation and trend analysis of critical geometric dimensions can also be performed in the production process.

Viscom equips its inspection systems with a comprehensive portfolio of algorithms to record geometric values during wirebond inspection. For gold wire bonds with diameters less than 25 µm, the Viscom VHR module’s special illumination enhances geometric features. The VHR module’s resolution of approximately 3 µm per pixel produces standard deviations in wedge widths of 1 µm.

Every change in the bond process can be discovered and any negative trend can be corrected immediately. With this method, Viscom also meets the automotive industry’s requirements of a maximum width tolerance of a few micrometers at 3 σ.

The tool benefits customers with high volume production requirements, as well as small- to mid-volume manufacturers in industries such as aerospace, aviation or medical electronics.

These measurement tools are available for all Viscom wire bond inspections. With help from the statistical process control VPC, measurement data can be pulled up at a moment’s notice and intervention limits defined.

For more information, visit http://www.viscom.com

Articles from Viscom:

Through-wafer Inspection for MEMS Devices 
Completely Inspecting New Packages
Viscom Opens Applications and Training Center in Mexico

(January 25, 2010) — On behalf of the World Gold Council (WGC), SEMI conducted a survey titled “Semiconductor Industry Opinions Concerning the Selection of Bonding Wire Material.” The survey was intended to gauge the semiconductor industry’s use of copper bonding wire versus gold for packaging applications. The WGC is a commercially driven organization focused on creating demand for gold. While 41% of semiconductor companies surveyed use copper bonding wire, none use it in the majority of their products. However, the majority of respondents will consider copper bonding wire in their new products.

With respondents for 14 of the top 20 semiconductor suppliers (2008 ranking), the survey included 46 companies, IDM and fabless, with 2008 revenues totaling $137 billion. This is representative of 55% of the global semiconductor industry in terms of revenues. Over the past 5 years, the price of gold has climbed steadily, with the exception of a late-2008 plummet that coincided with the recession. Copper prices, on the other hand, have fluctuated greatly, currently in a long decline that began mid-2008.

SEMI asked survey participants, on behalf of the World Gold Council: What do you consider to be important advantages of gold bonding wire over copper bonding wire in packaging applications? To what degree do you currently use copper bonding wire technology in your products/packages? To what degree is your company considering a switch from gold to copper wire in new product/package developments in the next three years? What are the main issues or concerns that would prevent your use of copper wire technology in the future? To what extent is end-of-life recyclability (of waste electronics) a factor in your current bonding wire material selection? It is estimated that over 50% of the economic value of some end-of-life electronic products is derived from the gold content of the waste. This value contributes to the economic viability of electronics recycling. Were you aware of this or not?

Copper wire use on the rise

Consumption of copper wire has been growing in the industry as the price of gold has increased in recent years. The majority of companies (72%, 33 companies) are considering a switch from gold to copper wire for some types of new products. Of those surveyed, 13% are considering it for the majority of products, and 15% are not considering switching. Seven companies will not use copper wire for new products, though two of those companies use and will continue to use flip chip technology. Six companies are considering copper wire technology for a majority of their new products.

According to the recently completed Global Semiconductor Packaging Materials Outlook report issued by SEMI and TechSearch International, 2009 copper wire shipments from the major wire suppliers to the semiconductor industry will reach approximately 5.8% of total shipments (in meters), up from just 1.6% of the shipments reported in 2007.

Gold bonding wire remains a mainstay

All respondents except one identified advantages of gold bonding wire over copper bonding wire. Twelve companies selected “Total Cost” as their only response in identifying advantages of gold wire over copper wire.

59% of the companies surveyed do not use copper interconnect wire. Of the 46 companies responding to the question, a total of 27 companies currently are not using copper wire in products, including 14 IDM and 13 fabless. The main concerns that would prevent the companies using copper wire technology in the future (in order) is in-service reliability, closely followed by process yield, and unproven historical performance. Companies also stated that advanced packaging needs, such as formation of complex wire loop shapes and high metal layer counts and complex pad structures prevent switching to copper wire. Gold is also credited with better electrical performance.

Although sustainability of electronic goods is becoming an increasingly important issue, very few companies are aware of, or are influenced by, the economic value or recyclability of EOL electronic packages. Eighteen companies surveyed were unaware that over 50% of the economic value of some end-of-life (EOL) electronic products is derived from the gold content and only 21% of companies consider the impact on recyclability of waste electronics when selecting bonding wire material.

Methodology

The surveys were conducted from October 13, 2009 through December 15, 2009. Surveyed companies include both integrated device manufacturers (IDM) that have internal semiconductor device (chip) production and fabless semiconductor companies that design their own chips but outsource the manufacturing of both the die and package. Wafer foundries and packaging subcontractors were not included in the survey as final design decisions rest with the IDM and fabless companies. While many IDMs package their own chips, some utilize packaging subcontrac¬tors for the final packaging, assembly, and testing of their chips. These back-end manufacturing partners offer gold and, increasingly, copper bonding wire capacity.

Twenty-eight IDMs and 18 fabless companies responded to the survey. Combined revenues of the 46 responding companies totaled $137 billion in 2008, or 55% of the total worldwide, $248.6 billion, reported by World Semiconductor Trade Statistics Bluebook. The 46 companies responding to the survey were globally selected. The survey includes responses from fourteen of the top twenty ranked suppliers for 2008. This report documents responses to six questions covering trends and issues related to both current and future bonding wire needs. Some companies did not reply to every question.

The survey operators

The World Gold Council’s mission is to stimulate and sustain the demand for gold and to create enduring value for its stakeholders. The organization represents the world’s lead¬ing gold mining companies, who produce more than 60% of the world’s annual gold production in a responsible manner and whose Chairmen and CEOs form the Board of the World Gold Council (WGC). The WGC has its headquarters in London and operations in the key gold demand centers of India, China, the Middle East and United States.

The SEMI Industry Research and Statistics group provides market data and research reports covering semiconductor capital equipment, semiconductor materials, packaging materials, and fabs. We collect actual data from suppliers around the world following strict professional standards of confidentiality. Our reports help the industry make important investment, strategic and planning decisions by providing timely and accurate market research and market forecasting programs. For more information visit www.semi.org/marketinfo

Related reading:

The Great Debate: Copper vs. Gold Ball Bonding
Towa’s Novel Chip Packaging Technique Uses Less Gold
Flip Chip Interconnection Using Copper Wire Bumps 
Wire bonding 
The back-end process: Step 4 – Wire bonding step by step

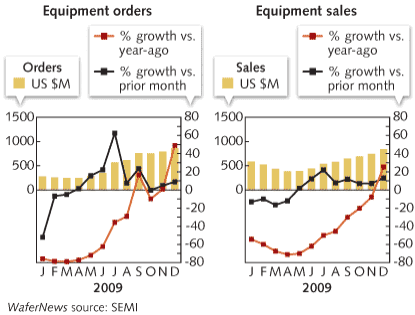
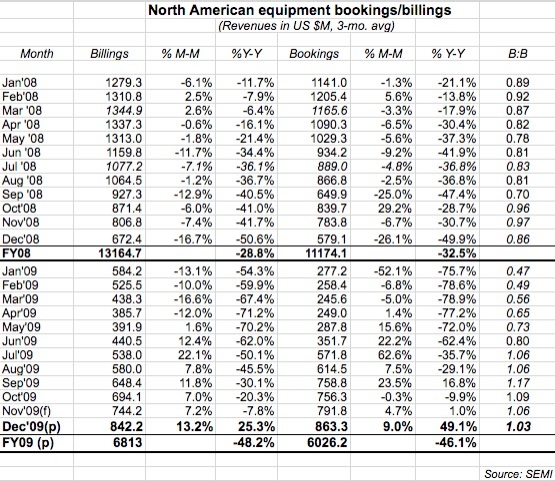
January 25, 2010 – Demand for semiconductor capital equipment continued to increase in the final month of 2009, and with the key book-to-bill ratio now six straight months above parity suggests growth still lies ahead, according to the latest industry data.

According to SEMI, orders for semiconductor manufacturing equipment reported by North America-based suppliers totaled about $863M, up about 9% from November and more than 49% better than Dec. 2008. Billings of $842M rose about 13% sequentially and were up more than 25% compared with a year ago. Both statistics are based on three-month moving averages.

Click to Enlarge

The book-to-bill ratio, though still above parity for a six straight month, actually slipped a little bit to 1.03, meaning $103 worth of orders was received for every $100 worth of product billed for the month, a ratio that continues to indicate more business coming in than going out. Signs continue to point to the industry increasing spending on technology and filling out capacity to produce semiconductor devices, noted SEMI president/CEO Stanley T. Myers, in a statement.

Click to Enlarge

Meanwhile, in Japan, semiconductor equipment demand kept climbing in December as well. bookings rose more than 10% to ¥77.386B (about US $861M), while billings were up about 4% from November to ¥59.557B ($663M); the B:B thus rose slightly to 1.30, staying true to roughly where it had been for most of 2H09. Comparisons with a year ago, when the depth of the market’s tanking was just starting to be understood, are not surprisingly stellar: bookings up 127.3% from Dec. 2008, and billings up nearly 22%.

(January 22, 2010) MINNEAPOLIS — The Surface Mount Technology Association (SMTA) will host two 90-minute online sessions with Bob Willis, ASKbobwillis.com, on package-on-package (PoP) applications and implementation. The Webtorials will take place February 4 and February 11, 2010 from 1:00 to 2:30 pm EST.

PoP applications are growing in popularity for mobile and handheld professional electronics applications, placing further demands on assembly engineers. In simple terms, POP represents the stacking of components one on top of another either during the original component manufacture or during printed board assembly. As real estate is at a premium for logic and memory, PCB designers say the only way to go is up and up. PoP packaging systems may include direct soldering, wire bonding, or conductive adhesives for device to device interconnection.

PoP is new to many contract and OEM assembly staff but with the demands of paste dipping, reflow warpage, increased placement accuracy/Z-axis control process introduction can be demanding. The difficulty in multi-level ball inspection can be a challenge for X-ray equipment procedures as level one balls can mask level two and three interconnections. Manual inspection can be used but with these applications space is often not available for side viewing. Each delegate will receive a free set of package on package inspection and quality control wall charts covering optical and X-ray inspection, dip flux and paste application, placement criteria and defects seen during assembly.

This webtorial suits design, production and quality engineers looking at future technology and maintaining a company technology roadmap. It’s vital to subcontractors to be up-to-date with new technology and its possible implementation along with material and equipment requirements for future customers.

Topics include:
What is Package on Package (PoP)?
Benefits of PoP Stack Packages
Component Standards
Component Types
JEDEC Standards
PCB Design Rules
Pad Layout
Via Hole Connection
Lead-Free Assembly
Engineering Interviews
Stencil Printing
POP Placement 
Tack Flux
Dip Solder Paste
Reflow Soldering
Convection
Vapor Phase Soldering
Temperature Profiling
Inspection
Optical Inspection
X-ray Inspection

Underfill
Rework
Package on Package Defects
 
Bob Willis currently operates a training and consultancy business based in England with a large collection of interactive training CDs. A specialist in implementing lead-free manufacture, Willis provides worldwide training and consultancy in most areas of electronic manufacture and design. He has worked for OEM and contract assembly, printed board manufacture and environmental test facilities. This recently earned him the SOLDERTEC Global Lead Free & SMTA International Leadership Award plus IPC Committee Award for his contribution to industry. Willis is a Fellow of the Institute of Circuit Technology and awarded Life Long Vice President of the SMART Group.

Register through the SMTA Online Registration System: http://www.smta.org/education/registration/event_registration.cfm

January 21, 2010 – Unidym Inc. says it has completed three agreements to nonexclusively license out its intellectual property related to carbon nanotubes (CNT) for use in applications including aerospace and military.

The three deals are as follows:

– A unidentified large Japanese materials company, for technology (US Patent #6,852,410) covering use of CNTs to make high-performance carbon fibers for structural composites

Torrey Pines Technologies, a San Diego-based maker of RF, microelectronics, and automated equipment, for a suite of patents related to using vertically aligned nanotubes and nanofibers as thermal interface materials.

Nano Lab, a Boston-based manufacturer of vertically aligned CNTs, for technology (US Patent #6,863,942) covering growth of vertically aligned carbon nanotubes on certain substrates.

"Licensing our IP outside of our core market in printable electronic materials, illustrates the breadth of Unidym’s patent portfolio," said Mark Tilley, CEO of Unidym, in a statement. "In-line with our strategy to monetize the value of our IP, we will continue to seek revenue generating licensing opportunities beyond the markets in which we intend to sell our high-margin electronic inks and films."

January 15, 2010 –  Researchers at Northeastern U.’s Electronic Materials Research Institute have created a 3D nanolens from metamaterials to provide more accurate and detailed imaging of nanoscale objects.

Conventional lenses construct an image of an object using ordinary waves, but not the tiny subwavelength details of nano-sized objects that are carried by "evanescent" waves. Previous uses utilized amplified evanescent waves in thin metallic films or metal-dielectric layers, but were restricted to very small thicknesses (<< λ, wavelength) and thus short distances due to losses in the material.

In their new work, reported in the Jan. 11 issue of Applied Physics Letters, the Northeastern researchers arranged and packaged millions of nanowires (20nm dia.) in a way to control how light passes through the lens; by using both ordinary and evanescent waves to construct an image, the lens can depict a clear, high-resolution image of nanosized objects.


Super-resolution imaging with subwavelength resolution by the metamaterial nanolens at 1550nm. The nanolens consists of high aspect ratio metallic nanowires which are embedded in a host dielectric medium. The resolution of the lens is more than 2x better than the diffraction limit. (Image courtesy of Northeastern U.)

From the abstract:

Here, we present an experimental demonstration of super-resolution imaging by a low-loss three-dimensional metamaterial nanolens consisting of aligned gold nanowires embedded in a porous alumina matrix. This composite medium possesses strongly anisotropic optical properties with negative permittivity in the nanowire axis direction, which enables the transport of both far-field and near-field components with low-loss over significant distances (>6λ), and over a broad spectral range. We demonstrate the imaging of large objects, having subwavelength features, with a resolution of at least λ/4 at near-infrared wavelengths.

"This is the best superlens realized so far, and is a significant development in the field of high-resolution optical imaging," said Srinivas Sridhar, prof. and chair of physics at Northeastern, in a statement.

Sridhar claims the group already has capabilities for large-scale production of the nanolenses, and wants to begin manufacturing "in the near future," he added. End applications include biomedical imaging and lithography techniques. The work is funded by the National Science Foundation and the US Air Force.

by John Klawender and Terry Bluck, Intevac

EXECUTIVE OVERVIEW
Historically, semiconductor OEMs have developed, manufactured, and marketed semiconductor equipment as a unit, typically including a platform and process module(s). However, the main focus of equipment manufacturers is in the development of next-generation process modules while making minimal efforts in platform and performance innovation. Now, the necessity for a forward thinking, flexible platform is recognized as a vital element in order to meet the cost and productivity challenges of 450mm and beyond. Accelerating cost reduction for chip manufacturers demands an infrastructure change in the semiconductor equipment supply model that can only begin when OEMs commit to the development of a common platform and a common standard. The following paper presents the concept and capabilities of a universal platform and the results that were achieved through testing and system modeling.

December 28, 2009 – The worldwide semiconductor industry is now faced with the urgent challenges presented by the increased pace of IC development mandated by the International Technology Roadmap for Semiconductors (ITRS) and Moore’s Law. As we prepare for the transition from 300mm to 450mm, the International SEMATECH Manufacturing Initiative (ISMI) is developing standards to help equipment and IC manufacturers achieve an expedient, successful and rapid conversion. With the industry actively striving to implement innovative solutions to accelerate the next transition, reduce costs and improve the quality and productivity of chip manufacturing, the concept of platform interoperability has been clearly identified as a crucial element in equipment redesign.

Aligning with ISMI’s proposed roadmap to 450mm and the need for platform interoperability expressed by the world’s top IC manufacturers during ISMI’s October 2009 platform meeting, a breakthrough solution for the development of a universal platform was introduced. The new mainframe platform architecture, combined with a new wafer transfer system, will ultimately accelerate cost reduction, improve throughput, wafer processes and quality, and free equipment manufacturers to concentrate on developing next generation module and chamber technologies. A universal platform offers the capabilities necessary to meet the ongoing changes in design nodes and increasing wafer size.

Candidate for a standard solution

A common standard solution goes beyond establishing the standard interface for platform interoperability. Combining a new platform concept and design with a platform standard can produce significant benefits that can be realized by both chip and equipment manufacturers. Today’s platform and wafer transfer systems are mostly constrained by and limited to ‘chamber reach robot’ design with only rotational motion. To enable flexibility and maximize productivity, multiple robots must be used on individual platform units. This relay model commonly used in 300mm has reached its limit and no longer has the ability to enable a common standard approach that will benefit 450mm manufacturing.
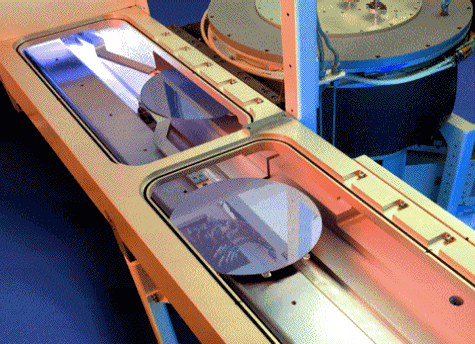
Click to Enlarge
Figure 1. Decoupled linear dual robots used in the universal platform design.

A platform with linear motion architecture is designed and developed to deliver a flexible, economical solution that enables the flexibility necessary to increase productivity. The new platform architecture (referred to as the universal platform in this paper) and wafer transport designs are shown in Figures 1 and 2. The universal platform is configured as an independent and self-functioning system, with mechanical, electrical, and software interface components. The universal platform allows friendly, hand-shake protocol and the ability to ensure platform interoperability. The compact design allows for easy expansion and chamber addition while minimizing the floor space needed. This design also enables the flexibility necessary for best-of-breed process chamber adoption.
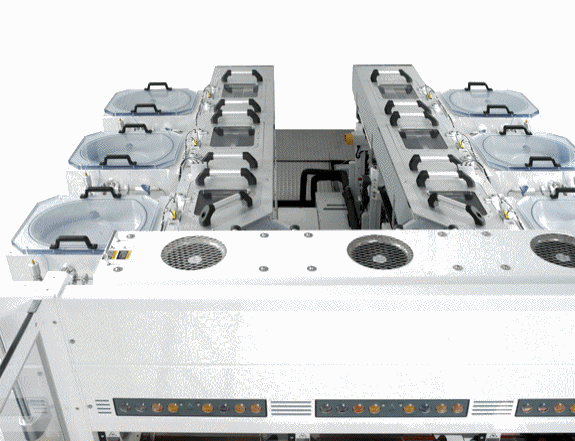
Click to Enlarge
Figure 2. The universal platform in dual transfer module configuration.

The universal platform consists of the mainframe, (also known as the platform in the equipment application), and provides all the handling capabilities between the equipment front-end module (EFEM) and the process modules or chambers. The mainframe consists of the load lock (LL) and the transfer module (TM). The LL has two substrate or wafer slots and serves as a process material exchange point between the atmospheric EFEM and the TM. The TM is designed with a mechanical interface connecting to multiple chambers, which are arranged in linear fashion. The TM uses linear dual robots equipped with a dual arm set. Each robot arm has a single blade for wafer transport. Both robot arms travel linearly inside the TM, guided by a liner track. Both robot arms are decoupled for completely independent operation, and are designed for optimized wafer exchange at a pick up/place station with dynamic wafer transfer algorithm, (a high speed signal processing system combined with a synchronized operational code for real time optimization and wafer swap strategy) and for high throughput performance.

The universal platform can be structured in different configurations, e.g., in single TM mode or parallel TM mode (Fig. 2). Single TM mode is configured with one mainframe, including one LL and one TM, connecting to a single EFEM. Parallel TM mode is configured by pairing two mainframes, each including one LL and one TM, to a single EFEM, with an optional vacuum wafer transfer station that connects the pairing TMs. In contrast to today’s conventional robot and platform concept, the universal platform is designed to allow multiple chambers to be configured on the same mainframe without adding additional robots.

Throughput modeling

To compare platform and wafer transport advantages, several throughput models and calculations were carried out based on the universal platform architecture, with different robot transport designs to mimic the semiconductor wafer manufacturing process sequence, including dual robots (for the universal platform design shown in Fig. 1 above), single-blade robot, single robot with dual blades (also referred as a double-bladed robot in the modeling).

The throughput model and calculation is based on the following assumptions and established model by M. Pinedo [1] and Perkinson et al. [2].

The LL is infinitely fast, and the wafers are always available for pick up.

  • Pick up time from a chamber is the same as drop-off time to a chamber. Pick up time is referred to as "T."
  • The time "T" is the same for every chamber as well as for the LL.
  • The time to move between any two chambers is constant (since it depends on the system configuration and cannot be predicted here). This time is regarded as an average time to move between the chambers.
  • The process job for all the wafers is the same — any given chamber will have an identical process time for every wafer visiting it.
  • The system is running in a steady state.

Furthermore, in order for a meaningful comparison, conservative approximations of the hardware speeds are made. Most notably: 

  • A chamber pick up time (T) is assumed to be 5 seconds.
  • Fast rotation time (without wafer) is assumed to be 0.25 seconds.
  • Slow rotation time (with a wafer) is assumed to be 2 seconds.
  • Fast linear move (without a wafer) is assumed to be 2 seconds.

Once a system has been fully populated with wafers, it is deemed to be working in a steady state. Perkinson et al., described this steady state as follows: "…where the inflow of a new wafer into the system and the outflow of the processed wafer from the system are equal." Throughout this paper we will be dealing exclusively with the steady state conditions.

Perkinson et al., also introduced the concept of the fundamental period and defined it as: "…the time between subsequent completed wafers arriving at the load lock." Later in this paper, it will be evident that robot speed, chamber process time, number of chambers in the wafer flow and the number of blades on the robot will all affect the fundamental period.

The inverse of the fundamental period is the measure of the number of wafers processed on a system within a unit of time, and it represents the throughput of the system.

Consider a simple serial processing on M chambers, where a wafer flow is given as:

m1  →  m →  …  →  mM

and assume that the process times in all the chambers are the same, i.e.:

t1  =  t2  =  …  =  tM  =  tmax

Once all the wafers have finished the processing step, the robot needs to advance them to the consecutive chambers, i.e., the wafer in the chamber mM is shifted out to the LL, the wafer in the chamber mM-1 is shifted to the chamber mM, the wafer from chamber m1 moves to chamber m2, and finally a new wafer is introduced into the system as it is being moved from LL to the chamber m1.

Let tboundary be the combined time the robot needs to shift all the wafers to the successive chambers during one advancement cycle. In the extreme case, when the process times in all the chambers are zero, the robot will start a new cycle immediately after it has finished the previous cycle. In fact, the same outcome will result for any process time >0, but shorter than tboundary. Such a system is deemed to be transfer bound and can be envisioned as a system where the robot is always busy, while the wafers are waiting for pick up in the idling chambers. Observe that the maximum throughput (μmax), obtainable by the machine (for a given set of chambers), can be achieved only in this region. The important consequences of working under the transfer bound region are:

  • Maximum throughput can be reached;
  • Process time does not affect the throughput;
  • Chambers utilization is poor.

When the process time exceeds tboundary, the robot will have to wait during each advancement cycle for the chambers to finish processing. In these settings, the system is deemed to be working in the process bound region. As the process time increases, the following results are noted:

  • Robot utilization decreases.
  • Chamber utilization increases.
  • Throughput decreases.

Note that the elapsed time between the starting times of two consecutive cycles is the same as the elapsed time between subsequent wafers returning back to the LL, which can be also viewed as the fundamental period of the system.

Finally, the initial stipulation was that the process times in the chambers were equal. We will relax this requirement now and propose that only the sole chamber with the largest process time needs to be considered. This single chamber, described as the bottleneck (in the process bound region), is the only chamber that affects the throughput; the process times of all the other chambers are of no consequence (on the following pages we shall assume that all the chambers are bottlenecks).

Serial and parallel wafer processing

There are two commonly used process sequences in wafer fabrication in use with conventional vacuum equipment; serial and parallel processing. Serial processing is described next with throughput model for linear transport system.

In the serial processing model, wafers are transported to one or more chambers based on a given serial processing sequence. In all the cases analyzed, the wafer flow is: m1 → m2 → … → mM, and the processing times in all the chambers are assumed to be equal (t1 = t2 = …. = tM = tMAX).

Single blade robot. The "pull" strategy of advancing wafers with a single-bladed robot is illustrated below. This strategy has been devised by Perkinson et al., and is considered to be optimal.

  • Pick up a wafer from chamber mM, make a slow move to LL, and drop off the wafer.
  • Make a fast move to chamber mM-1, pick up the resident wafer, make a slow move to the chamber mM and drop off the wafer.
  • Continue in this fashion until the wafer from chamber m1 is moved to chamber m2.
  • Complete the cycle by picking up a new wafer from LL, making a slow move to chamber m1 and dropping off the wafer.

The process times were set to match the boundary condition, i.e., the new movement cycle starts immediately when the previous cycle is completed, and each wafer is picked up as soon as it is finished processing. The sum of the times associated with all robot actions during one movement cycle is the fundamental period for the transfer bound region and, as can be seen on the diagram, is given by:

FP  =  (M+1) (2T + tslow + tfast)

By extending the process time in any of the chambers, the system will enter the process bound region. The fundamental period will be a composition of the process time and the time needed to perform one wafer swap.

FP  =  tmax + 2(tpick + tdrop + tslow) + tfast  =  tmax + 2(2T + tslow) + tfast

By equating the above equations, the boundary between the regions can be established:

Tboundary  =  (M – 1) (2T + tfast + tslow) + tfast

Double bladed robot. This is the robot system where the two blades are incapable of making individual, decoupled rotary moves. We assume that both blades always face the same direction. The equations given would be analogous if the blades were rotated with respect to each other.

An optimal "swap" strategy for double bladed robot is given in Venkatesh et al. [3].

  • Pick up a wafer from the LL with one blade.
  • Rotate slowly to face chamber m1, pick up the resident wafer with the empty blade and replace it with the wafer acquired from LL.
  • Rotate slowly to face chamber m2, pick up the resident wafer with the empty blade and replace it with the wafer acquired from chamber m1.
  • Continue in this fashion until all the chambers have been swapped.
  • Complete the cycle by slowly rotating from chamber mM to LL, picking up a new wafer with the empty blade and dropping off the wafer picked up from chamber mM.

 Transfer bound:  FP  =  (M+1) (2T + tslow)

Process bound:  FP  =  tmax + 2T

Tboundary  =  M (2T + tslow) + tslow

Dual robots. The decoupled linear robots (i.e., two individual robots based on the universal platform design, shown in Fig. 1 above) in a linear transfer module can perform individual tasks independent from each other, and thus have the potential to outperform the coupled robots or blades in more challenging scheduling problems (e.g., two different process jobs running simultaneously). For a simple serial processing scheduling problem, the swap strategy, as described above, can also deliver optimal operation by decoupled robots.

Transfer bound:  FP  =  (M+1) (2T + tfast)

Process bound:  FP  =  tmax + 2T

Tboundary  =  M (2T + tfast) + tfast

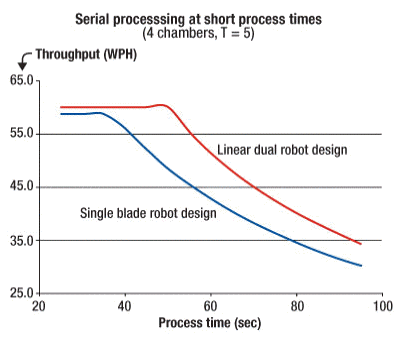
The modeling of linear dual robots is shown in the Figure 3 modeling comparison.
Click to Enlarge
Figure 3. Throughput comparison of single blade robot vs. dual robot design as function of process time, in serial processing mode, based on the universal platform.

Effect of chamber addition

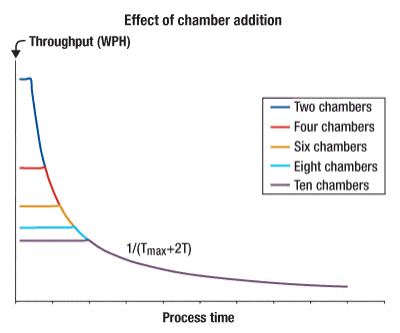
To further enhance the throughput for the linear dual robot system on the universal platform, the effect of chamber addition is investigated. Since the maximum throughput is achieved in the transfer bound region, and the fundamental period for the transfer bound region during serial processing is a function of the number of chambers used, it follows that by adding more serial chambers the fundamental period will increase in this region; therefore, the maximum attainable throughput will be increased, as seen in Figure 4.
Click to Enlarge
Figure 4. Throughput comparison for different numbers of process chambers, for example M = 2, 4, 6, 8 and 10 chambers, for the linear dual robot design, in serial processing mode, based on the universal platform.

Parallel TM mode

To further maximize the throughput for the system with a large number of chambers used in serial processing, utilization of parallel transfer chambers of the universal platform is demonstrated. For the universal platform with parallel TM mode (two mainframes: side A TM and side B TM, connecting to one EFEM, with optional wafer transfer station connecting the pairing mainframes), ideal configuration can be achieved. In an ideal chamber configuration, in terms of the number and position of the chamber(s), the robots in each transfer chamber need to service only half of the total load, thus reducing the transfer bound fundamental period, which virtually doubles the maximum throughput.

To derive the fundamental period for a system with parallel transfer modules the following assumptions were made:

  • A wafer enters the system through the LL on Side A and leaves the system through the LL on Side B.
  • There is an even number of process chambers on the system.
  • For a wafer flow m1 → m2 → … → mM, the chambers m1 … mM/2 were placed on side A, while the chambers mM/2+1 … mM were placed on side B.
Transfer bound:  FP  =  (M/2+1) (2T + tfast)

Process bound:  FP  =  tmax + 2T

Tboundary  =  M/2 (2T + tfast) + tfast

Parallel TM configuration allows for a substantial maximum throughput improvement as can be observed in Figure 5. For jobs requiring fewer process steps, the unused positions can be used to multiply the number of the bottleneck, thus driving tmax down toward tboundary, and increasing the throughput in the process bound region. The significant advantage of this configuration is shown in Fig. 5.

Click to Enlarge
Figure 5. The model compares single blade robot vs. linear dual robot design, and single vs dual TM configuration with linear dual robot design, based on the universal platform architecture.

Actual wafer processing has been carried out to validate the modeling and performance of the linear dual robot system in serial processing mode on the universal platform. Modeling and wafer processing were also conducted for parallel processing mode based on different wafer transport design and architecture to mimic the semiconductor wafer manufacturing process sequence. In the parallel processing model, wafers are transported to only one chamber. Similar results were concluded comparing linear dual robots, single blade robot, and double-bladed robot. The results revealed the significant advantages of the universal platform design with the linear dual robot transport system over alternative wafer transfer designs used in the traditional cluster mainframe or relayed modular linear mainframe designs.

Conclusion

The linear dual robot design demonstrates an innovative solution and presents a challenge to traditional cluster platform and new modular platform architecture. The universal platform architecture brings true innovation to semiconductor equipment design and cost and productivity benefits to both equipment and IC manufacturers. The transition to 450mm presents an opportunity for the industry to consider an out-of-box platform approach and realize a win-win solution based on a common standard.

Biography

Janusz Klawender received his BS in computer science at Union College, Schenectady, N.Y., and is a member of the technical staff, software, at Intevac, 3560 Bassett Street, Santa Clara, CA 95054 USA; ph.: 408-588-2110; e-mail: [email protected].

Terry Bluck received his BS in physics at San Jose State U., San Jose, and is VP of engineering at Intevac; ph.: 408-246-2214; e-mail [email protected].


References

[1] M. Pinedo, Scheduling : Theory, Algorithms, and Systems, 2nd ed., Upper Saddle River, NJ: Prentice Hall, 2002.
[2] T. L. Perkinson, P. K. McLarty, R. S. Gyurcsik, R. K. Cavin III, "Single-Wafer Cluster Tool Performance: An Analysis of Throughput," IEEE Trans. Semiconductor Mfg., vol. 7, pp. 369-373, Aug. 1994.
[3] S. Venkatesh, R. Davenport, P. Foxhoven, and J. Nulman, "A Steady-State Throughput Analysis of Cluster Tools: Dual-Blade Versus Single-Blade Robots," IEEE Trans. Semiconductor Mfg., vol. 10, no. 4, pp. 418-424, 1997.


December 23, 2009 – A new $6.5M award from the National Institute of Standards and Technology (NIST) will support efforts from Brewer Science and Southwest Nanotechnologies (SWeNT) to improve production of high-purity, high-quality metallic and semiconducting carbon nanotube (CNT) inks.

Under the funding, part of NIST’s Technology Innovation Program aimed to support "high-risk, high-reward research in areas of critical need," the two firms will research and develop cost-effective commercial-scale production of the CNTs and inks for a variety of potential uses in various electronics applications: optical devices, photovoltaic cells, batteries, supercapacitors, lighting, flexible electronic devices, and sensors. The work will combine SWeNT’s single-wall carbon nanotube technology and production capabilities with Brewer Science’s background in CNTs purification, separation, and dispersion.

"CNT inks and films are poised to enable several important new technologies that address national needs, and we are very pleased to have our development efforts supported and recognized," stated Terry Brewer, president/CEO of Brewer Science.

December 21, 2009 – Semiconductor manufacturing equipment demand slowed a bit in November but still kept up a pace of growth, lending more weight to the outlook for improved fab spending heading into 2010, according to the latest data from SEMI and SEAJ.

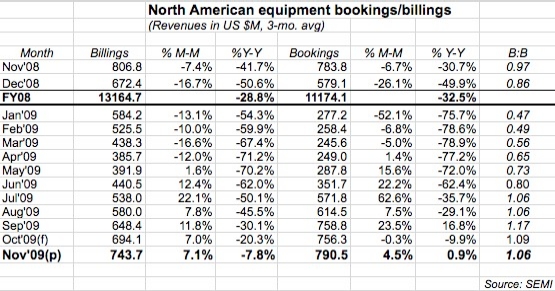
According to SEMI’s latest numbers (three-month moving averages), orders for semiconductor manufacturing equipment reported by North America-based suppliers totaled about $790.5M, up about 4.5% from October and just under 1% growth compared with Nov. 2009.

Equipment billings in November totaled $743.7M, about 7% higher sequentially and just about -8% lower than a year ago — that’s the first time the Y-Y comparison has been a single-digit decline since March 2008.

Click to Enlarge

And the book-to-bill ratio (B:B) has stayed above the parity mark for five months now; November’s B:B of 1.06 means $106 worth of orders for every $100 worth of product billed for the month, a ratio that continues to indicate more business coming in than going out.

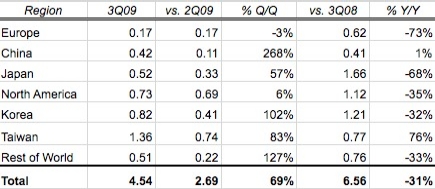
Widening the view to the entire 3Q09, equipment bookings nearly doubled from the prior quarter to $5.83B, and rose about 4% from 3Q08. Billings rose about 69% Q/Q to $4.54B, though that’s -31% lower than a year ago. These numbers were compiled jointly by SEMI and the SEAJ, representing monthly data reported by 110 global equipment companies.

Click to Enlarge
Quarterly billings data by region, in US $B. (Source: SEMI)

Demand in Japan for semiconductor manufacturing equipment also slowed, but is still on an upward trend, according to numbers from the Semiconductor Equipment Association of Japan (SEAJ). Global orders reported by Japanese-based manufacturers totaled ¥70.016B (US $775.0M), up about 5.4% from October and nearly 38% from Nov. 2008; billings rose roughly 15% month-on-month to ¥59.42B ($656.4M), though that’s down about 12% from a year ago.

The November equipment demand picked up slightly compared with the flatness seen in October, and its "relatively slow but steady" pace continues to track inline with a forecast of improving spending heading into 2010, noted SEMI president/CEO Stanley Myers, in a statement.